A method to dramatically improve the display of the top command that I learned for the first time after 20 years of work as an infrastructure engineer

table of contents
Hello, I'm Seiken. I've been in Canada for just under a year, but my English hasn't improved at all and I still respond to "how are you?" with "I'm fine, thank you."
The top command is a favorite among all infrastructure engineers, and it's probably the first command you learn when operating a server at Beyond.
It's actually quite a deep command, and it can do a lot of different things, so until now I've been proudly passing on my experience as a senior to my juniors, saying things like, "You can do this too," but I'd like to introduce a super-convenient way to use it that I recently discovered for the first time. It's
a bit long, but please bear with me.
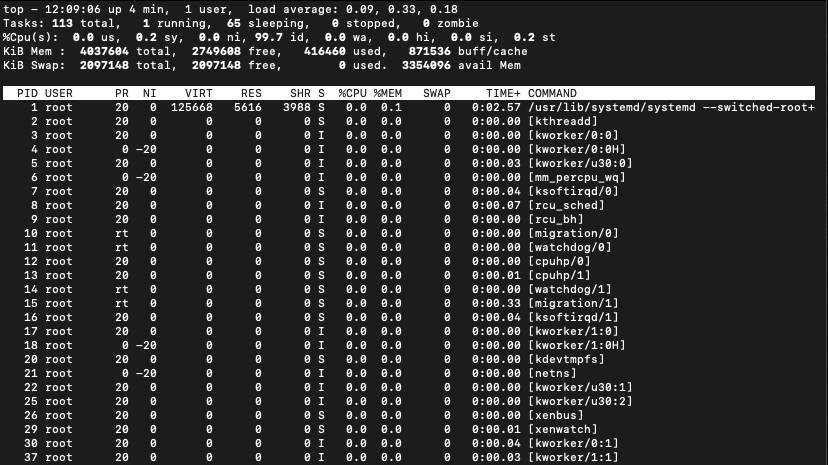
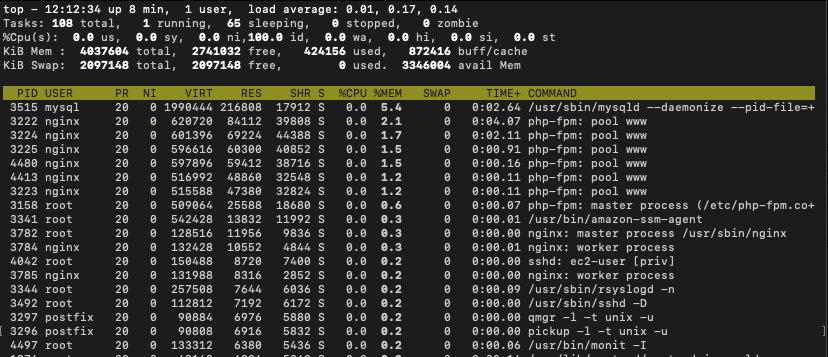
When you run the top command, the following screen will be displayed:
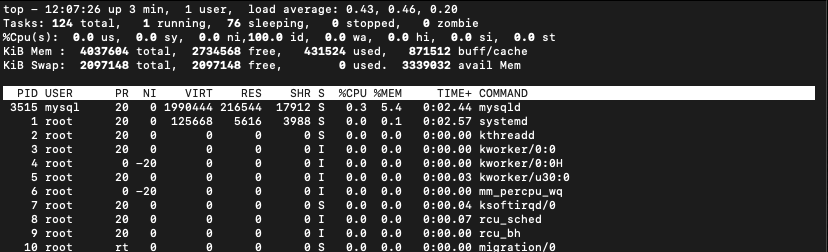
This alone is packed with important information for server operation, but I think there are many other articles that explain how to use the top command, so I will skip it this time
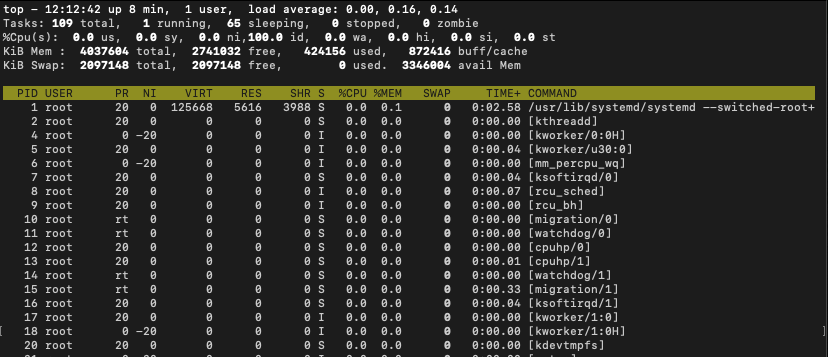
This time, let's make the final display of this top command look like this:
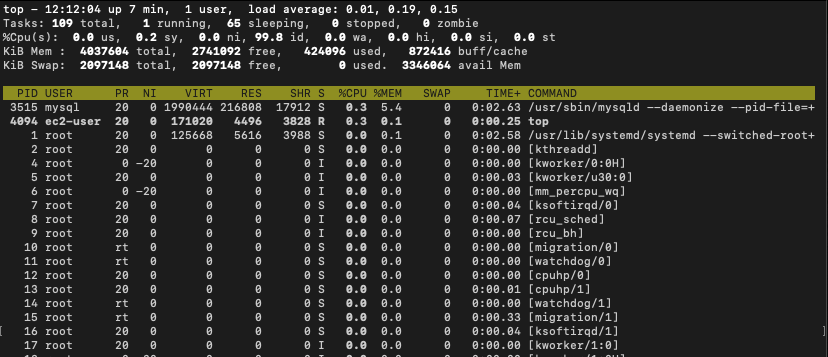
There are five points
- Display detailed information such as process arguments
- Add display items and change the display order
- Show processes with a status of RUNNING and the sorting column in bold
- Change the sort order
- Save your settings (this is the most important part)
Let's try it now
Display detailed information such as process arguments
This is easy, just press c
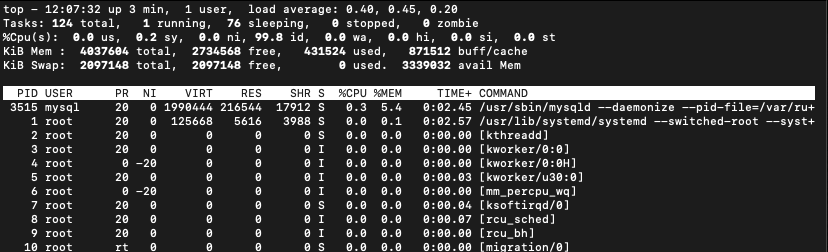 You can get the same result by adding the -c option when you first run the top command, but this
is useful if
Add display items and change the display order
In our normal operations, we monitor not only critical situations such as when a customer's service or process stops, but also CPU and memory usage to quickly detect situations where server resources are about to run out and take action to prevent failures before they occur.
The three indicators that are often used in this case are CPU usage, memory usage, and SWAP usage, but SWAP usage is not displayed by default with the top command.
However, top has several fields that are normally hidden, and you can make it so that SWAP usage is also displayed.
let's do it
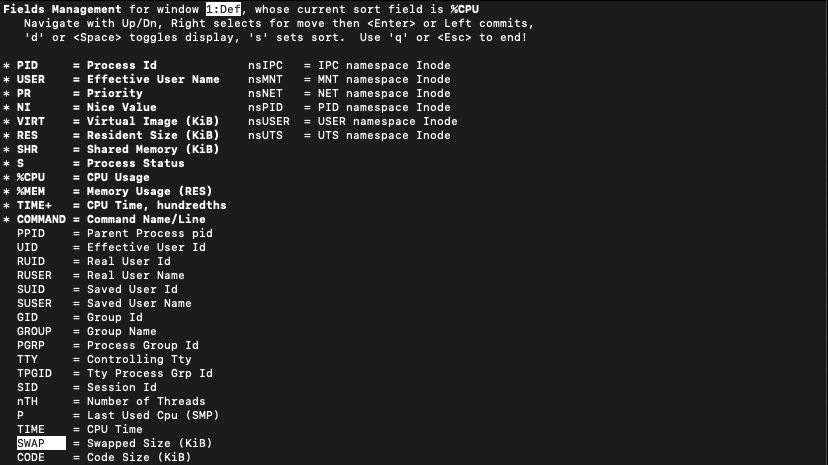
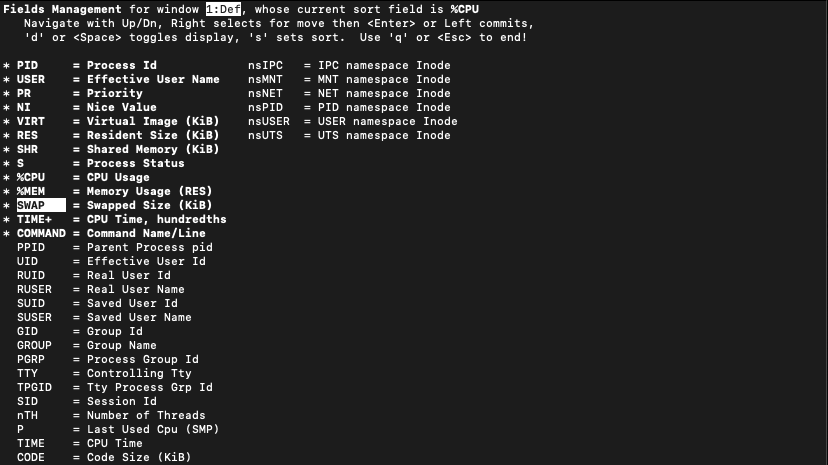
Pressing Shift+f will change the Field Management screen to the following:
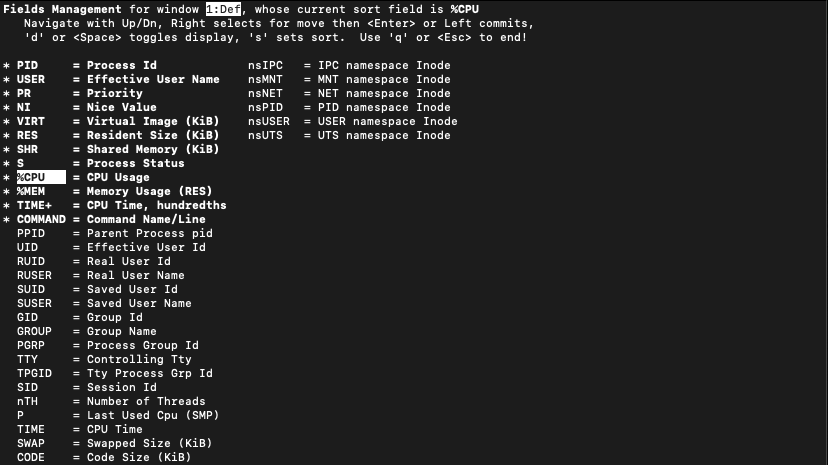
This time, we want to add the SWAP usage to the display, so use the up and down arrow keys to move to the SWAP item
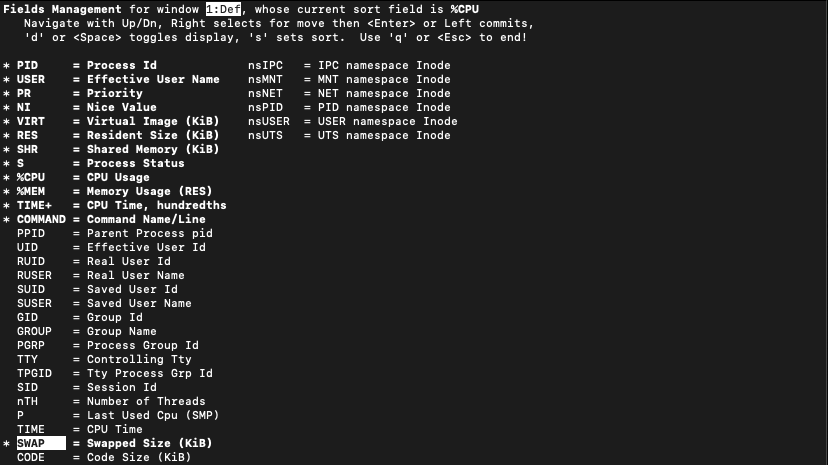
Press the space bar to add an * to the left of the item, and it will be added to the display items
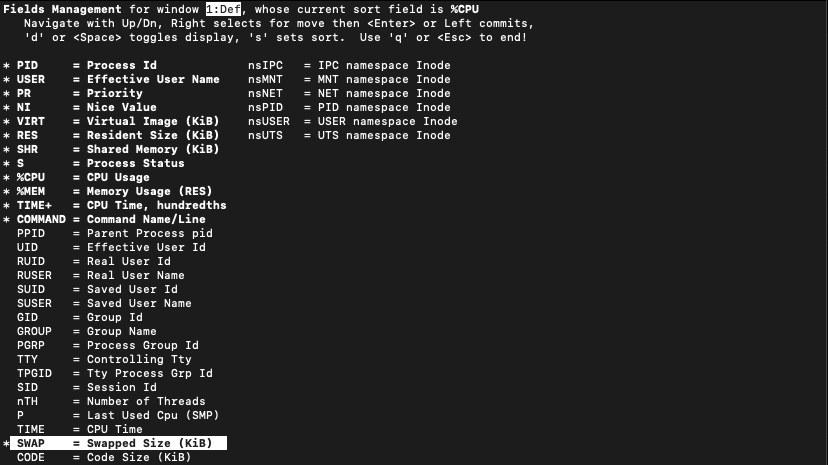
If left as is, it will be displayed after COMMAND, so we will display it after %MEM to make it easier to compare with other indicators
Pressing the right cursor key will expand the selection cursor slightly, allowing it to be moved
Use the up and down cursor keys to move to the desired location
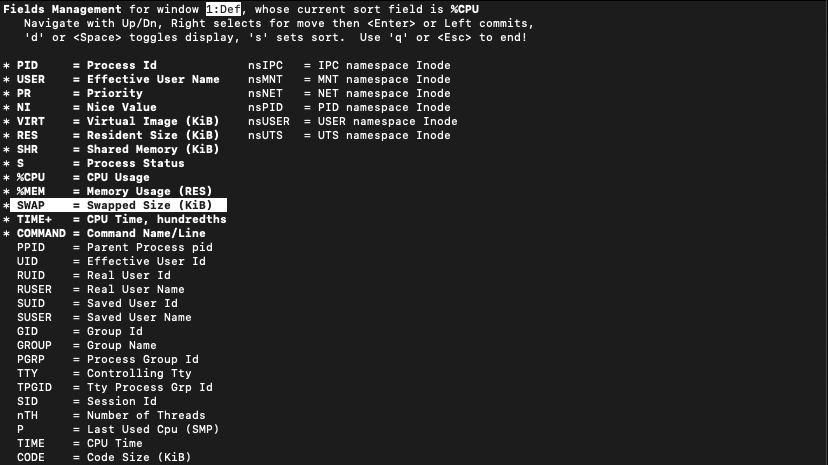
Once you have finished moving it, press the left cursor key to return it to its original selection state and fix its position
Press q or Esc to exit the Field Management screen
The SWAP item has been added next to %MEM
Show processes with a status of RUNNING and the sorting column in bold
Now that we have made it visually easier to understand, let's make the processes with a status of RUNNING and the currently sorted column bold.
Let's also change the color of the screen that is displayed.
Press Shift+z to display the following screen:
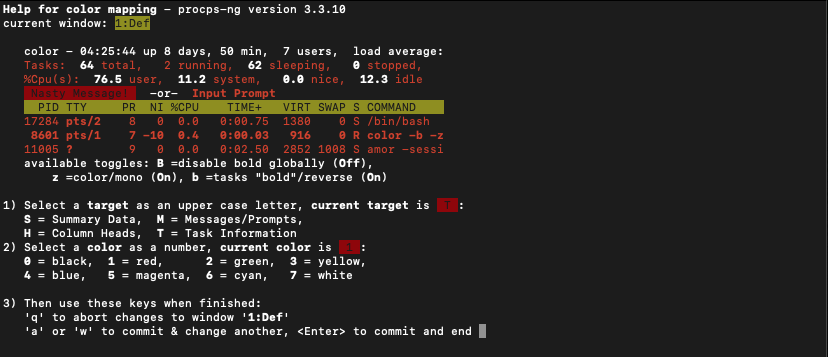
You can change the color for each field, but for some reason the default is red
It looks a little poisonous, so press 7 to change it to white

The "Summary Data" column above is also red, so use "shift+S" to switch the field whose color you want to change and press 7 in the same way to change it to white
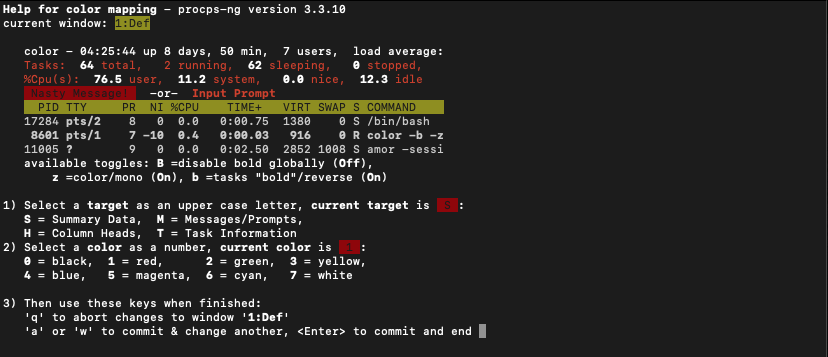
If you press shift+s, the part "1) Select a target asu an upper case letter....." will change, which is a little confusing
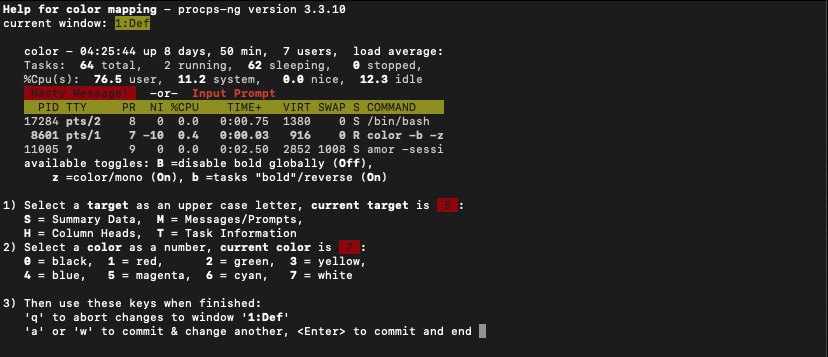
Entering a number will change it to your preferred color. I tried a few different ones but ended up settling on 7 (white).
There are many other colors besides white, so please choose the color you like.
To save this state and exit, press "Enter"
If the screen color settings you selected earlier are saved, you've succeeded
Furthermore, let's bold processes with a status of RUNNING, and also bold the field we're currently sorting by
Pressing the x key will make the field you are sorting bold, and pressing y will also make processes with a status of RUNNING bold
It's a little hard to see in the Mac terminal, but can you see that the sorting field (%CPU) and the status (S) of the process with RUNNING (R) status (in this case, the top command) are highlighted in bold?
Change the sort order
I think that the top command has become much easier to use. In
our daily operations, we need to investigate the cause of alerts that occur on customer servers, so we often want to sort by memory usage or SWAP usage in addition to the default CPU usage display.
In such cases, you can move the sort field left or right by pressing "shift+<" or "shift+>"
It's a little hard to understand, but I tried changing the sort order from %CPU to %MEM to SWAP by using shift+>
. There are also shortcuts: shift+p (sort by %CPU) and shift+m (sort by %MEM).
Save your settings (this is the most important part)
Finally, let's save the settings we've made so far.
We've tried changing the display in various ways, but if we exit the top command as it is, the display will return to its original state the next time we run the top command.
It's a hassle to repeat these steps every time,
If you want to save the current display state, press "shift+w"
The current settings are saved in a file called .toprc in the home directory of the user running the top command
By the way, the explanation so far includes some parts specific to the top command of RedHat 7 series (CentOS 7, Amazon Linux 2)
The top command of other OSes may require slightly different operations, but you can accomplish almost the same thing, so if you
have any requests on how to do it on other OSes (which I doubt you'll hear), I'll be happy to help.
This will help us deal with monitoring alerts more efficiently from tomorrow!
We may be the only ones who think this, but we hope that this article will be useful to someone, even if they don't know it.
 2525
2525 The person who wrote this article
About the author