[Anaconda×Diagrams] Drawing a configuration diagram using Python
table of contents
Introduction
It's been a while.
This is Mikoto from the Systems Solutions Department, and I'm starting to feel anxious as my second year is about to end.
I think it would be incredibly powerful to be able to freely use Infrastructure as Code (IaC) like Ansible or Terraform, butPython so I haven't been able to play around with it much lately.
During my student days, I only dabbled a little in Unity (C#), but I got cocky and tried to run something called Allosaurus (a program that converts audio files into phonemes) using Anaconda , which I knew absolutely nothing about. I failed miserably, and that's when I started to hate Python. This time, in order to overcome that trauma, I'm going to try generating an infrastructure diagram in code, like a proper infrastructure engineer would, using my nemesis, Anaconda
About the execution environment
Ubuntu 22.04 (Vagrant)
conda 25.11.1
Python 3.10
Vagrant.configure("2") do |config| config.vm.box = "bento/ubuntu-22.04" config.vm.network "private_network", ip: "192.168.55.15" config.vm.network "forwarded_port", guest: 8888, host: 8888 # config.vm.provider "virtualbox" for Jupyter do |vb| vb.memory = "4096" end end
(⌒3⌒)<Why not just have Vagrant up set up the Anaconda environment?
But this time, the goal is to overcome the trauma of Anaconda, so I'm going to go to the trouble of doing the installation manually.
*The more I use it, the more I think venv is better. I'm just using Anaconda because I don't want to continue to dislike it, so please use venv
Building a virtual environment
Setting up Anaconda
First, we'll download the latest version of the Anaconda installer. (This was the latest version at the time.)
$ wget https://repo.anaconda.com/archive/Anaconda3-2025.12-2-Linux-x86_64.sh
Running the downloaded Anaconda installer will start the installation. In this case, we are extracting anaconda3 to the home directory of a test user named conda-test
$ sh Anaconda3-2025.12-2-Linux-x86_64.sh
------Omitted------- Anaconda3 will now be installed into this location: /home/conda-test/anaconda3 - Press ENTER to confirm the location - Press CTRL-C to abort the installation - Or specify a different location below [/home/conda-test/anaconda3] >>> PREFIX=/home/conda-test/anaconda3 ------Omitted-------- To install conda's shell functions for easier access, first activate, then: conda init Thank you for installing Anaconda3!
Installation complete!
As instructed in English, run the following immediately after installation to enable Anaconda.
conda init
The page will be reloaded to apply the settings.
At this point, you will be moved into the Anaconda environment.
source ~/.bashrc (base) conda-test@vagrant:~$
Once you have the path set, check the version
$ conda --version conda 25.11.1
By the way, once the Anaconda installation is complete, Python is included, which is very convenient!
/home/conda-test/anaconda3/bin/python Python 3.13.9
Furthermore, upon installation, you'll have a set of well-known libraries already installed, eliminating
the need to install them one by one using `pip install`.
(Although Diagrams, which we'll be using this time, isn't included.) These include
: Pandas
, NumPy
, Matplotlib
, Seaborn
, and Jupyter.
You can also check if the library you want is available from the command line.
(⌒3⌒)<I don't understand what's what, but there are so many, it's amazing!
$ conda list
Installing Graphviz
Graphviz is a graph creation tool that uses a data description language called DOT
Diagrams is a library used to create configuration diagrams, and requires Graphviz to run in a local environment, so we will install it
$ sudo apt install graphviz
Once installed, check the version and location
$ dot -V dot - graphviz version 2.43.0 (0)
$ which dot /usr/bin/dot
Setting up a virtual environment
Next, instead of installing Diagram, we'll set up a virtual environment.
As a Python beginner, I've had plenty of frustrating experiences with library dependencies (smug face), so I'll put the libraries in a virtual environment so I can easily discard it if it breaks.
To create a virtual environment with Anaconda, use the following command.
This time, we're going to draw a configuration diagram, so I've named it "draw-env".
$ conda create -n draw-env python=3.10
By default, the virtual environment is stopped, so we will start it.
Now the virtual environment is ready!
From here, we will proceed with preparation and development on draw-env.
$ conda activate draw-env (draw-env) conda-test@vagrant:~$
At that moment, I thought to myself,
(⌒3⌒) <Hey, doesn't this look like venv?
...I thought for a moment, but since my main goal is to overcome my trauma, this is fine.
Installing Diagrams
Now, let's get to the main topic: installing Diagrams.
As mentioned earlier, it's not available just by installing Anaconda, so you'll need to install something additional.
$ pip install diagrams
The diagrams library is installed within the draw-env environment we created.
Now that we've reached this point, we can finally start coding to draw the configuration diagram!
Draw a configuration diagram
Now we finally move on to drawing the configuration diagram.
I hope we can finally say goodbye to those days of painstakingly drawing it piece by piece using VS Code's draw.io.
the documentation, it looks like a full set of popular icons will be available.
Diagrams currently supports main major providers including:
AWS,Azure,GCP,Kubernetes,Alibaba Cloud,Oracle Cloudetc... It also supportsOn-Premisesnodes,SaaSand majorProgrammingframeworks and languages.
Create a python file
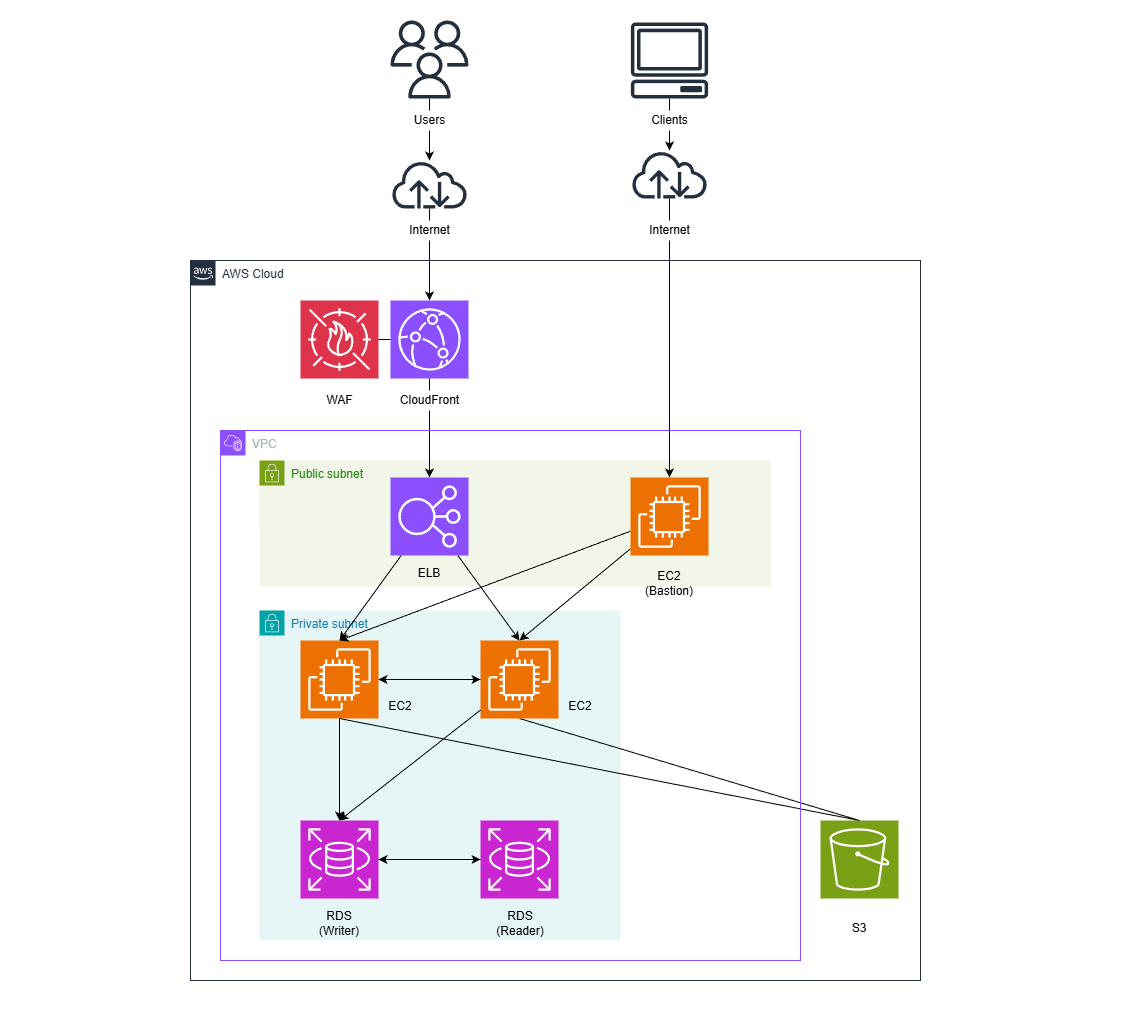
The goal for this project is the following configuration.
(I used drawio for this project.)
Personally, I find it difficult to write code in the terminal, so I create my Python files in VS Code
from diagrams import Cluster, Diagram, Edge from diagrams.aws.compute import EC2 from diagrams.aws.database import RDS from diagrams.aws.network import VPC, PrivateSubnet, PublicSubnet, CF, ELB from diagrams.aws.security import WAF from diagrams.aws.storage import S3 from diagrams.aws.general import Users, Client with Diagram("", direction="LR", show=False) as diag: # 1. User layer user = Users("Users") client = Client("Clients") # 2. External service layer s3 = S3("S3") with Cluster("", graph_attr={"style":"none", "penwidth":"0"}): waf = WAF("WAF") cf = CF("CloudFront") waf - cf # 3. Network layer (VPC) with Cluster("VPC"): with Cluster("Public Subnet"): lb = ELB("ALB") bastion = EC2("EC2(Bastion)") with Cluster("Private Subnet"): webs = [EC2("EC2"), EC2("EC2")] db_primary = RDS("Writer") db_replica = RDS("Reader") db_primary - Edge(style="dashed") - db_replica # 4. Route definition user >> cf >> lb >> webs >> db_primary client >> bastion >> webs webs >> s3
Try it out
Execution is extremely simple.
Just run the file you created in Python!
python draw-test.py
What will the result be?
drwxrwxr-x 2 conda-test conda-test 4096 Feb 21 11:55 ./ drwxr-x--- 9 conda-test conda-test 4096 Feb 21 11:55 ../ -rw-rw-r-- 1 conda-test conda-test 1440 Feb 21 11:55 draw-test.py -rw-rw-r-- 1 conda-test conda-test 132253 Feb 21 11:55 web_services.png
Oh, the image file is created!
So I downloaded it to check it out...
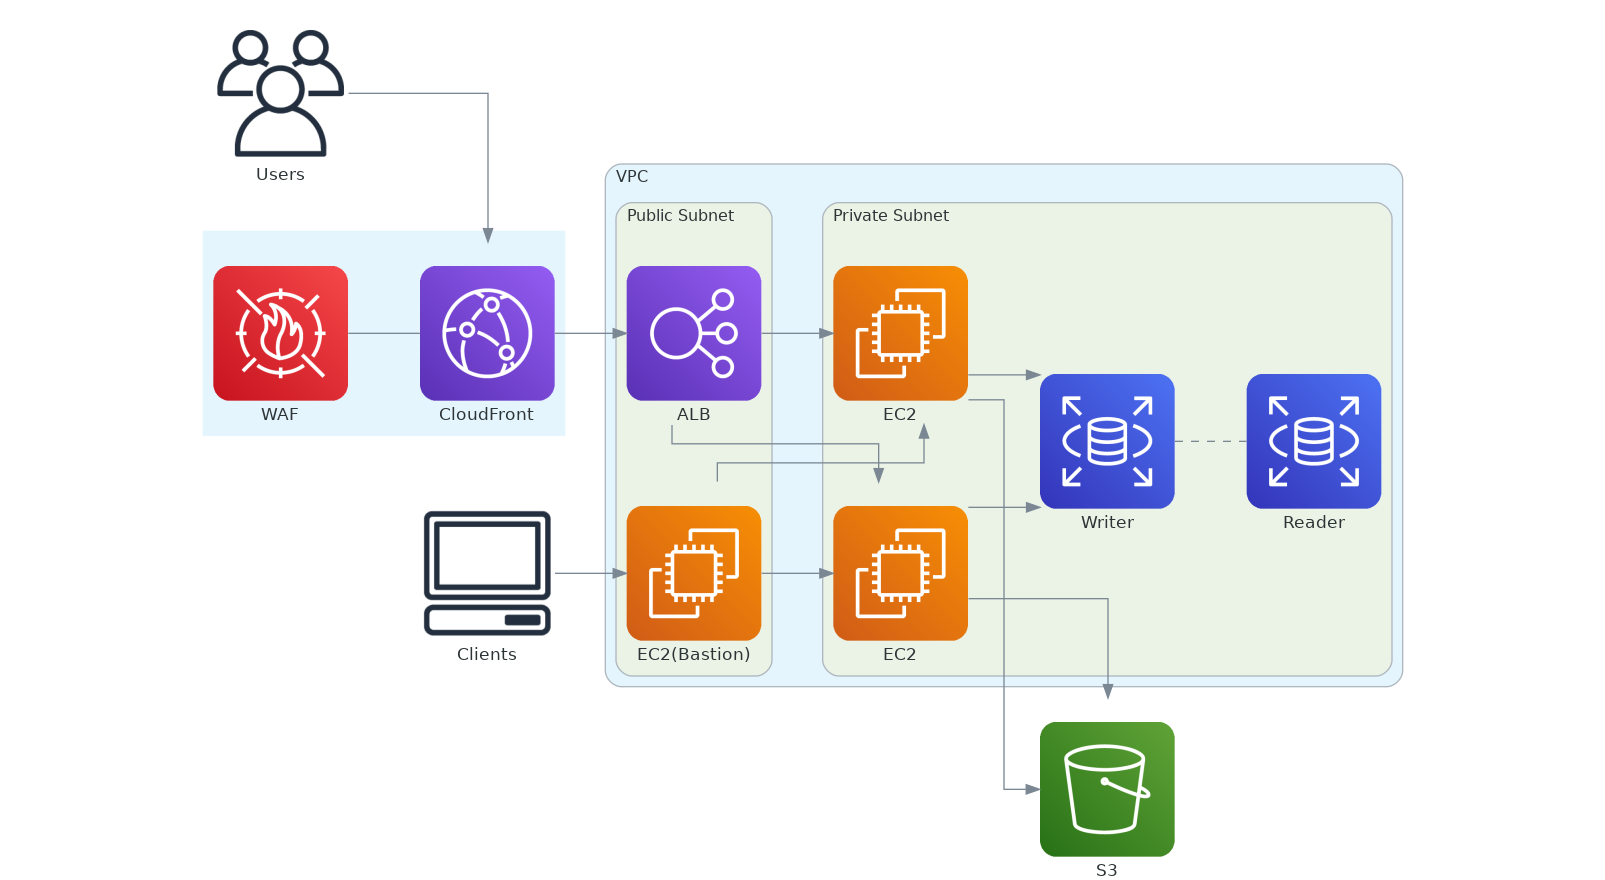
Oh, wow, they're all lined up nicely!!! 🎉🎉🎉It
was getting too long when it was vertical (TB), so I changed it to horizontal (LR) to make it neater.
(⌒3⌒)<(Though there are a lot of arrows so it might be a little hard to see)
How to write Python files
From here on, this is just a bonus, so if you don't need it, feel free to skip it, but for my own reference, I'll give a brief explanation of the contents
This part should be straightforward, but the process for importing AWS icons is as follows. The documentation describes how to write each resource to import , so please refer to it
from diagrams import Cluster, Diagram, Edge from diagrams.aws.compute import EC2 from diagrams.aws.database import RDS from diagrams.aws.network import VPC, PrivateSubnet, PublicSubnet, CF, ELB from diagrams.aws.security import WAF from diagrams.aws.storage import S3 from diagrams.aws.general import Users, Client
The user layer describes resources that cannot be contained within a VPC, Subnet, etc. In this case, there is no need to enclose them in a Cluster and they can be described independently
# 1. User layer user = Users("Users") client = Client("Clients")
This describes the external service layer and network layer. To make it easier to understand, you can create a framework and put the internal resources inside it. This is done by describing the internal resources within a class called `Cluster`.
*You can also name the `Cluster`, and you can separately configure its display/hide settings.
*To hide it, leave the argument empty.
# 2. External service layer s3 = S3("S3") with Cluster("", graph_attr={"style":"none", "penwidth":"0"}): waf = WAF("WAF") cf = CF("CloudFront") waf - cf
This describes each resource.
To draw them in parallel, use an array of square brackets [].
You can change the appearance of the lines by using Edge.
with Cluster("Private Subnet"): webs = [EC2("EC2"), EC2("EC2")] db_primary = RDS("Writer") db_replica = RDS("Reader") db_primary - Edge(style="dashed") - db_replica
Finally, let's look at the routing part.
You specify the destination using ">>". This part is straightforward!
If you're configuring CloudFront to deliver directly to S3, you just need to write cf >> s3 to change the location.
# 4. Route definition user >> cf >> lb >> webs >> db_primary client >> bastion >> webs webs >> s3
lastly
So, what did you think?
This time, in order to overcome my trauma with Anaconda, I created a virtual environment and generated a configuration diagram.
When I actually started using it after starting work as an engineer, I found that I was able to set up the execution environment and run it without much difficulty
Next time, I'll try to learn how to use Anaconda more effectively! See
you then!
reference
https://qiita.com/sakai_noriko/items/53d65f3177b891f6cfcc
https://qiita.com/lighlighlighlighlight/items/8f624751df808d89d48c
https://dev.classmethod.jp/articles/graphviz-beginner/
https://qiita.com/hiesiea/items/860c42a96b031f929b94
https://dev.classmethod.jp/articles/diagrams-introduction/
 33
33 The person who wrote this article
About the author