About the next version of Zabbix “3.4”

table of contents
This is Ohara from the technical sales department.
This time I will write about Zabbix, which is rumored to be the next version of Zabbix.
According to a recent announcement from Zabbix Japan,
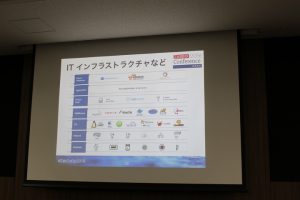
the layers that Zabbix specializes in monitoring
are mainly the lower layers of IT infrastructure such as "hardware, network, and OS."
In the next version, ``3.4 (or 4.0)'',
it will be possible to monitor the upper layer ``applications, services, IoT'', etc.

■Quoted from Nikkei Computer article
Current latest version
The latest version of Zabbix is "3.0" for LTS (5-year long-term support version) and
"3.2" for point release version (supported until the next version release with latest features)
The main features of the latest version, the current version 3.2, are as follows.
・Event tag function that organizes monitoring information
・Event correlation function that treats different monitoring data as one related source
・Fault screen function that allows you to check a list of problems that are occurring, etc.
Is there something other than IT infrastructure to be monitored?
Traditionally, Zabbix has been used mostly to monitor IT infrastructure, but
in the future it will also be possible to monitor IoT, collecting data such as temperature and humidity and performing real-time analysis.
Recently,
there seems to be an increasing number of inquiries asking, "Can Zabbix be used for IoT (Internet of Things)?", so we will implement it with that in mind.

Main enhancement points in next version 3.4 and later
We are currently working on the next version of Zabbix 3.4 (4.0), and
some of the functions have been released to be included in Zabbix 3.4 (4.0).
■ Visualization and dashboards
Not only is it easy to understand for system administrators, but
it also uses a large amount of data stored in the Zabbix database
to display information that can be used in presentations to management, and
a dash that serves as an indicator for business decision-making. Equipped with board function.
■ Simple configuration monitoring of commonly used devices and applications
With the current Zabbix, it takes time to configure settings and consider monitoring methods for each target, so we created
a function that allows you to set up monitoring and start using it with just a few clicks on your browser.
■ Business-level monitoring (e.g., application performance monitoring)
What users really want to know is the quality of the services they are using, so
we are strengthening the monitoring capabilities of the services provided, rather than the monitoring status of individual functions or devices.
■ All-inclusive monitoring
A function that allows you to comprehensively monitor multiple monitoring systems that you are already operating in a single view.
■ Standardization
In the Zabbix community, various users create and share monitoring templates, but
in order to ensure uniform quality, we set standards for templates and review them to
provide users with best practices for the best monitoring. do.
summary
Our MSP service mainly uses Zabbix for monitoring, but
since
many of our users are developing and operating social games and web services,
we It looks like it will be very convenient as even performance management can be operated with Zabbix.
As a side note, it is said that it will eventually be compatible with IoT, so
it will be possible to monitor IoT-compatible home appliances at home, and
it will also be possible to issue alerts when electricity usage rates and charges reach set thresholds. . .

![[Osaka/Yokohama/Tokushima] Looking for infrastructure/server side engineers!](https://beyondjapan.com/cms/wp-content/uploads/2022/12/recruit_blog_banner-768x344.jpg)
![[Deployed by over 500 companies] AWS construction, operation, maintenance, and monitoring services](https://beyondjapan.com/cms/wp-content/uploads/2021/03/AWS_構築・運用保守-768x344.png)
![[Successor to CentOS] AlmaLinux OS server construction/migration service](https://beyondjapan.com/cms/wp-content/uploads/2023/08/almalinux_blogbanner-768x344.png)
![[For WordPress only] Cloud server “Web Speed”](https://beyondjapan.com/cms/wp-content/uploads/2022/11/webspeed_blog_banner-768x344.png)
![[Cheap] Website security automatic diagnosis “Quick Scanner”](https://beyondjapan.com/cms/wp-content/uploads/2023/04/quick_eyecatch_blogbanner-768x345.jpg)
![[Reservation system development] EDISONE customization development service](https://beyondjapan.com/cms/wp-content/uploads/2023/06/edisone_blog_banner-768x345.jpg)
![[Registration of 100 URLs is 0 yen] Website monitoring service “Appmill”](https://beyondjapan.com/cms/wp-content/uploads/2021/03/Appmill_ブログバナー-768x344.png)
![[Compatible with over 200 countries] Global eSIM “Beyond SIM”](https://beyondjapan.com/cms/wp-content/uploads/2024/05/beyond_esim_blog_slider1-768x345.jpg)
![[If you are traveling, business trip, or stationed in China] Chinese SIM service “Choco SIM”](https://beyondjapan.com/cms/wp-content/uploads/2024/05/china-sim_blogbanner-768x345.jpg)
![[Global exclusive service] Beyond's MSP in North America and China](https://beyondjapan.com/cms/wp-content/uploads/2024/06/gloval_surport_blog_slider-768x345.jpg)
![[YouTube] Beyond official channel “Biyomaru Channel”](https://beyondjapan.com/cms/wp-content/uploads/2021/07/バナー1-768x339.jpg)
 0
0![[2025.6.30 Amazon Linux 2 support ended] Amazon Linux server migration solution](https://beyondjapan.com/cms/wp-content/uploads/2024/05/59b34db220409b6211b90ac6a7729303-1024x444.png)


