Use the top command like a seasoned engineer
2017.05.10
 3
3 
table of contents
Hello,
I'm Mandai, the Wild Team member of the development team.
It is said that when so-called hackers bypass various monitoring and blocking measures and log into a server, the first command they type is the "w" command, but when a server administrator detects an abnormality, the first command they type is probably the "ps" command or the "top" command
This time, I'll be a little more serious and introduce how to use the top command in a way that will set you apart from the crowd
Before you begin
When you run the top command, it is divided into two areas: an upper summary area that displays the resources of the entire system, and a lower task area that displays the running processes
Many of the functions that we will introduce below affect one of these, and we will use them in the explanations, so please keep them in mind
How to type the top command
I'll start off by saying that after logging in via SSH, it seems a bit amateurish to just type "top" a little too quickly
The top command can have arguments set just like other commands, so there's no reason not to take advantage of this.
It's better to have time to think about what arguments you need while you're logged in.
For example, to see the complete command being executed, type
top -c
Let's assume that
Also, if you want to change the default screen refresh rate of 3 seconds,
top -d 0.5 # Update the screen every 0.5 seconds
Let's assume that
To issue both of the above at the same time:
top -c -d 0.5 # or top -cd 0.5 # the following is bad top -dc 0.5
If you update the screen too quickly, the load will increase unexpectedly, so keep it moderate .
What you can do during execution
Summary area display switching
The summary area is broadly divided into three sections

- Uptime and overall load information (l) circled in red
- CPU and task information (t) enclosed in a green frame
- Memory and swap information (m) surrounded by a blue frame
You can display/hide these by pressing the corresponding keys (keys in parentheses)
Another important key is "1". If you press this key, the load on each core will be displayed individually if your CPU is multi-core
Task area display toggle
The default top screen allows you to understand the current system load, but it is also true that there are many items that are not displayed
While top is running, pressing "f" will display a list of items that top can display, and you can set them to be displayed or hidden.
On this screen, you can move the cursor up and down, so move the cursor to the item you want to display, and then press "d" or the space bar to make it bold, and that item will be displayed.
Swap usage, which is surprisingly difficult to obtain, can also be obtained on the top screen
Furthermore, if you press right after moving up and down, the entire item will be selected, and if you press up and down in that state, you can adjust the display order of the items
The video below shows the swap usage displayed and brought to the forefront of the command

Signal transmission
If you're wondering what a signal is, please check Wikipedia
The equivalent of "kill [pid]" can be performed in top
To do this, press "k" while top is running. If you press it by mistake at this point, you can escape by pressing the escape key
The message "PID to signal/kill" will appear above the task area, so enter the process ID you want to kill
Next, the message "Send pid [PID] signal [15/sigterm]" will be displayed, so send the signal name/signal number you want to send.
By default, sigterm (15) is sent, so if the process does not stop with this, try sending sigkill (9).
I recommend this because you can kill processes while looking at the top screen
Split-window mode (alternate-display mode) for experts
For some reason, top has an alternate-display mode that splits the screen into up to four parts to view running processes
split mode (as we'll call it here; the translated version of man top it's called alternate display mode) and regular fullscreen mode, use Shift + a.
The screen layout at the moment you enter split mode is as follows:
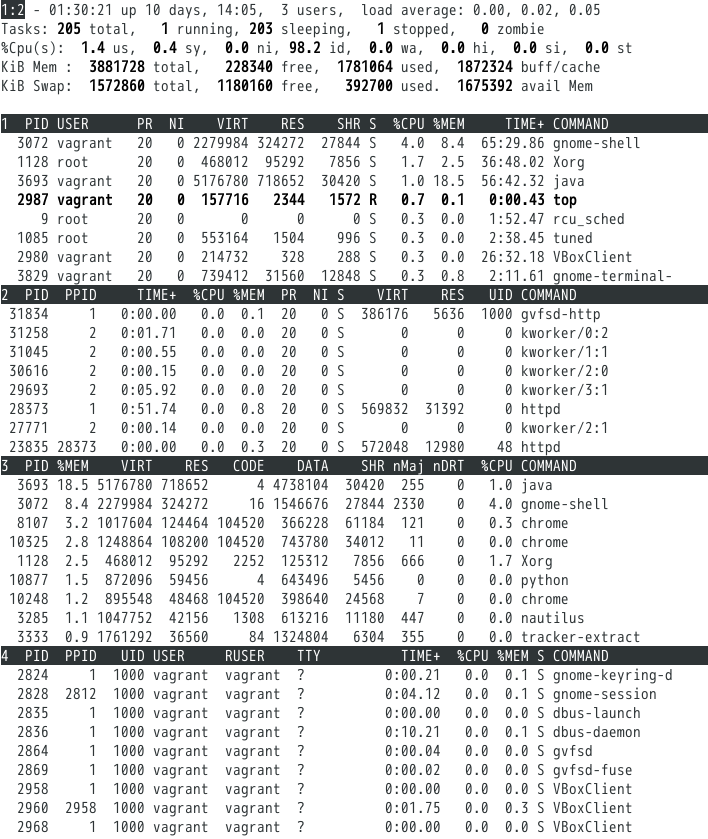
It's not the usual top! It's not a bug.
The idea is that you can have up to four different task areas, and you can adjust and switch between them according to the items you want to display.
The default is screen 1, and to move to other screens, press "a" to move forward and "w" to move backward.
Also, to move to a specific page, press "g" and then a number from 1 to 4, but since there are only four, you may not need to use it.
Once you've moved the screen, press Shift + a to return to full screen mode,
which will change the taskbar view to show the process filling the entire screen.
For each of these screens, you can use "f" to adjust the fields and specify the fields to sort by, so you can make adjustments
If you exit the program after adjusting it in split mode, the changes will revert to their original state, so if you output the settings file described below, the changes will be reflected in the program from the next time you start it up
Predefine the output state at startup
When detecting an abnormality and checking the top, it is often a race against time, so you can think of running it with arguments every time as a waste of time.
In that case, one option is to write it in a configuration file.
The configuration file that defines the display state is usually output to a file called "$HOME/.toprc" for each user
The setup is simple; after setting the display to your liking in top, just press "W" to exit.
It's a capital W, so if you have Caps Lock turned off, enter "Shift + w".
The resulting file looks like this:
top's Config File (Linux processes with windows) Id:i, Mode_altscr=0, Mode_irixps=1, Delay_time=3.0, Curwin=0 2 fieldscur=\¨³´»½ÀÄ·º¹Å&')*+,-./012568<>?ABCFGHIJKLMNOPQRSTUVWXYZ[\]^_`abcdefghij winflags=193844, sortindx=18, maxtasks=0, graph_cpus=0, graph_mems=0 summclr=1, msgsclr=1, headclr=3, taskclr=1 Job fieldscur=¥¦¹·º(³´Ä»½@<§Å)*+,-./012568>?ABCFGHIJKLMNOPQRSTUVWXYZ[\]^_`abcdefghij winflags=161076, sortindx=0, maxtasks=0, graph_cpus=0, graph_mems=0 summclr=6, msgsclr=6, headclr=7, taskclr=6 1 fieldscur=\º»<½¾¿ ÀÁMBNÃD34·Å&'()*+,-./0125689FGHIJKLOPQRSTUVWXYZ[\]^_`abcdefghij winflags=193844, sortindx=21, maxtasks=0, graph_cpus=0, graph_mems=0 summclr=5, msgsclr=5, headclr=4, taskclr=5 Usr fieldscur=¥¦§¨ª°¹·ºÄÅ)+,-./1234568;<=>?@ABCFGHIJKLMNOPQRSTUVWXYZ[\]^_`abcdefghij winflags=193844, sortindx=3, maxtasks=0, graph_cpus=0, graph_mems=0 summclr=3, msgsclr=3, headclr=2, taskclr=3 Fixed_widest=0, Summ_mscale=0, Task_mscale=0, Zero_suppress=0
To be honest, in this state it's completely unclear what's going on (although it's not impossible to read if you check each part individually), so I think it's best to avoid creating this file manually
Conversely, a properly configured file can be applied to other machines simply by copying and pasting it, so it can be easily reflected even when building using chef or ansible
Prepare multiple configuration files for the top command
As you get more enthusiastic about configuring the top screen, you will probably want to prepare multiple screen settings and use them depending on the situation.
However, the configuration file for top is "$HOME/.toprc" as mentioned earlier.
In fact, this was not the correct explanation
The correct format is "$HOME/.[top name]rc".
I experimented to see what the top name means.
# Check the current top path $ which top /usr/bin/top # Create a symbolic link to /usr/bin/top in /usr/bin/mytop $ sudo ln -s /usr/bin/top /usr/bin/mytop # Try running it $ mytop
This works fine and top opens as normal
Now, if you change any fields or display and save it, a file called "$HOME/.mytoprc" will be created
In this way, you can create a symbolic link and write different configuration files.
Your customized top will be executed under a different name, so it will not affect the normal top.
Start in batch mode
It is a big mistake to think that top is just a tool that displays the system status on the screen in real time; like the vmstat and sar commands, it also has a batch mode that sends the output results to standard output, allowing you to process and save them.
The following command will send the results of top to standard output.
top -b -n 5 -d 0.5
The "-b" option starts the program in batch mode, the "-n" option specifies the number of times to display,
and the "-d" option specifies the interval between displays.
In this case, the results of the top screen will be sent to standard output five times at 0.5 second intervals
Of course, you can pipe it to other commands, but the following command is often incorrect
top -b -n 5 -d 0.5 | head -n 5
If you try it, you'll understand what I mean.
Looking at the command, you can probably imagine what kind of result you want, but the top command is not suitable for this purpose.
summary
The top command is a useful command that can be useful in many situations, but did you realize that it can become even more useful by customizing it?
This is what it looks like in its entirety, but what's interesting is that you can make it as elaborate as you like depending on your customization options
This is how we monitor our servers 24 hours a day, 365 days a year
That's all
33 The person who wrote this article
About the author