Get access logs with AWS ELB!

table of contents

*Chicken Soba Zagin Main Branch (Higobashi, Osaka City)
Hello!
This is Hide, the Ramen King from Beyond Co., Ltd.'s Osaka office.
This is my second post.
This time, I'd like to write about how to obtain access logs using ELB.
Last time, I also wrote an article titled "Let's use Docker commands easily with Makefiles!", so
if you're using Docker, please check it out!
What are the benefits of obtaining access logs with ELB?
Some of you reading this article
might be thinking, "Huh? We can get access logs on the server, so it's unnecessary
It's certainly possible to obtain access logs on the server, so
there might not be much benefit to obtaining access logs using ELB....
I, the poster, also thought, "It can be done on the server, so there's no benefit..."
But what if you want to analyze access logs?
If the servers are distributed across multiple machines, the access logs will be stored on each respective server.
Therefore, even if you try to analyze access logs, they exist on separate servers,
making it quite time-consuming and laborious to integrate and analyze them.
For example, you can use CloudWatch Logs to aggregate logs.
In that case, you'll need to manage permissions with IAM, install agents on the target servers, and
edit the settings in awslogs.conf...
Alternatively, you can easily collect and utilize logs using an open-source data log collection tool called fluentd . However, this also requires managing permissions in IAM, installing and configuring the tool, and specifying S3 as the aggregation destination, which can be quite cumbersome...
To analyze access logs, you don't need to configure CloudWatch Logs or fluentd; you can easily aggregate access logs by enabling access logs on the ELB in front of your server !
Since all access logs are aggregated in S3, storage and analysis become easy.
Furthermore, by using AWS Athena and Redshift,
you can easily analyze the data in Amazon S3 using standard SQL!
Furthermore, even if access logs are lost due to a hang-up,
you can easily check the ELB access logs to see what happened.
Furthermore, since ELB is a fully managed service from AWS, you can use it with peace of mind. Even if a problem occurs, AWS will take responsibility for fixing it. Therefore, you can rest assured that it is extremely unlikely that you will encounter a situation where you "enabled it but can't get access logs..."
Now you understand the benefits of enabling access logs with ELB!
So, let's finally look at the setup procedure together!
Setup Procedure
①Go to EC2⇛Load Balancer
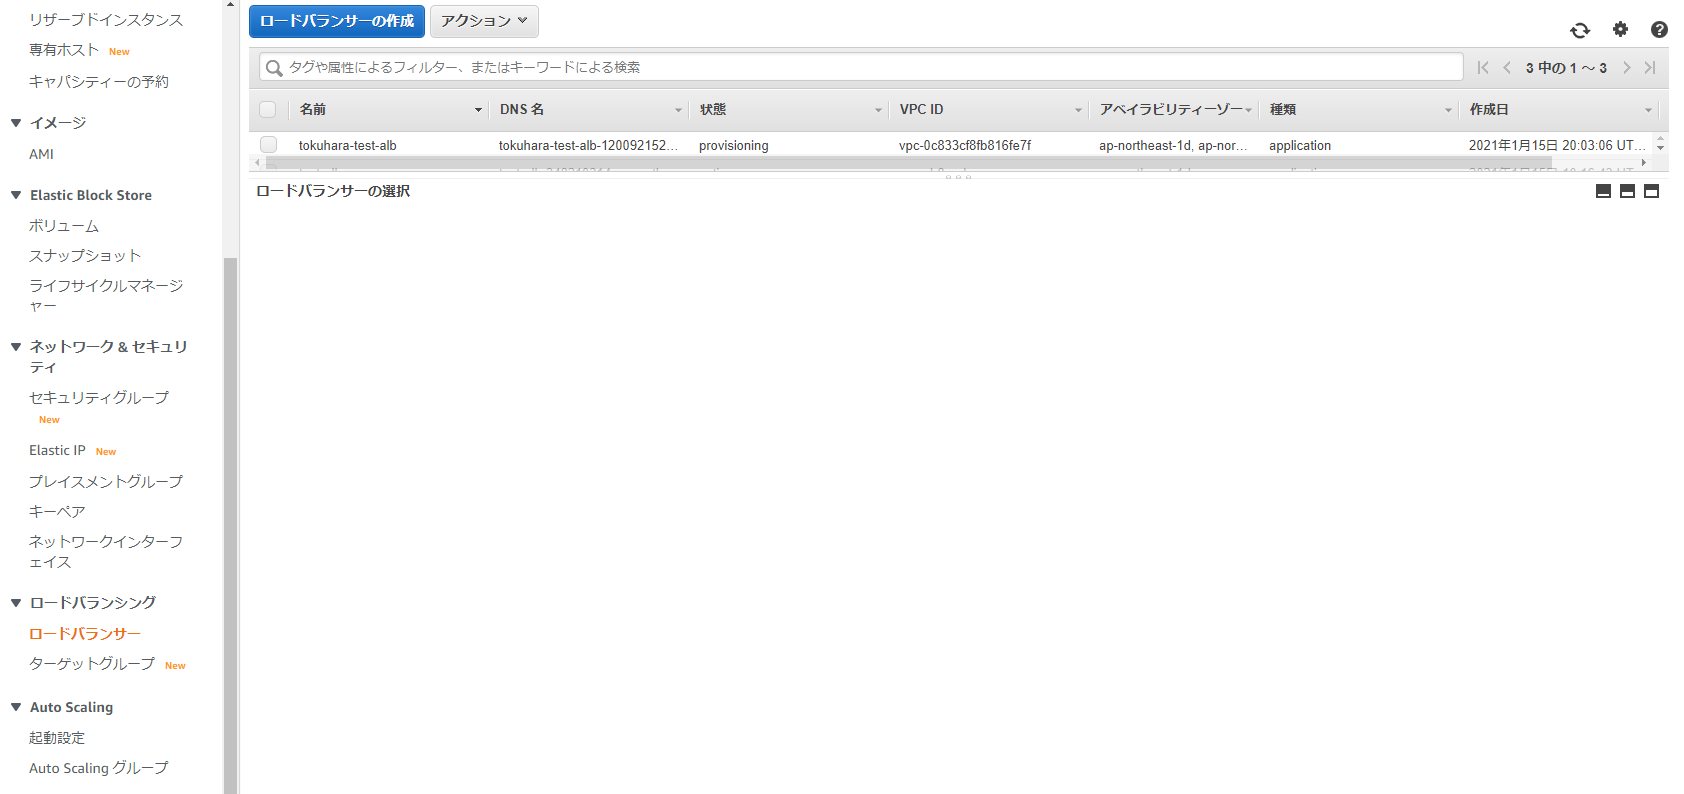
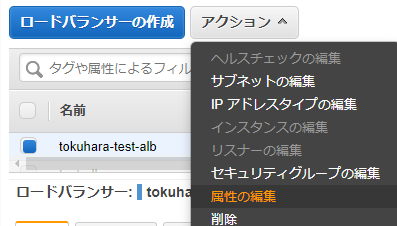
② Click [Edit Attributes] from the Actions menu
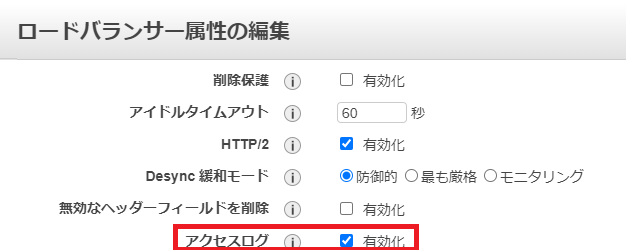
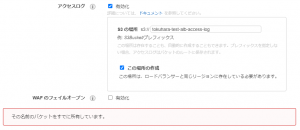
③Select Enable Access Log
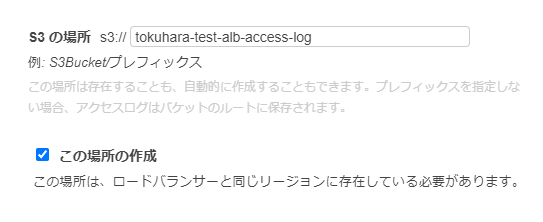
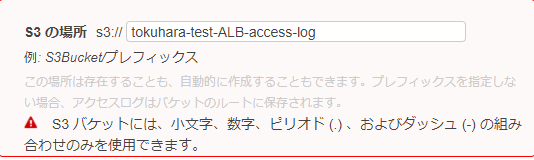
④Specify the bucket name for the S3 location
⚠① Only combinations of lowercase letters, numbers, periods (.), and dashes (-) are allowed in S3 buckets.
Please note that entering anything other than the above will result in an error as shown in the image below.
⚠②If the S3 bucket name you entered is already in use, a warning will be displayed and you will be asked to enter a different name

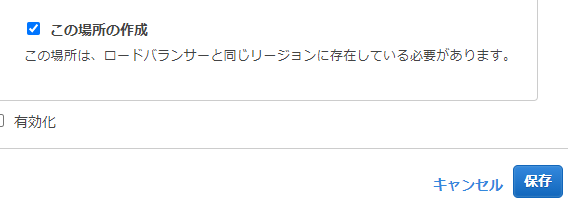
⑤ Check [Create this location] and click Save
⑥Go to S3 and click [Name of the S3 bucket you created]

⑦ Once you have confirmed that the access log file exists in the following directory, the process is complete
*Log files are created every 5 minutes
/Created S3 bucket name/AWSLogs/Elastic Load Balancing account ID number/elasticloadbalancing/Region name/Creation year/Creation month/Creation date/

How to check access logs
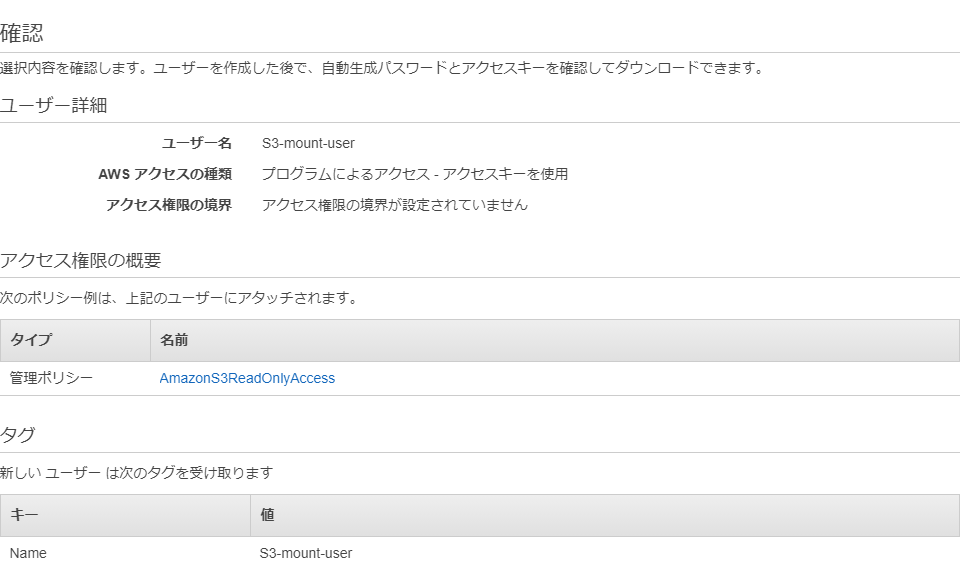
①Go to IAM and click [Create User]

② Fill in the necessary information
*Please make sure to check [Programmatic access] in the access type

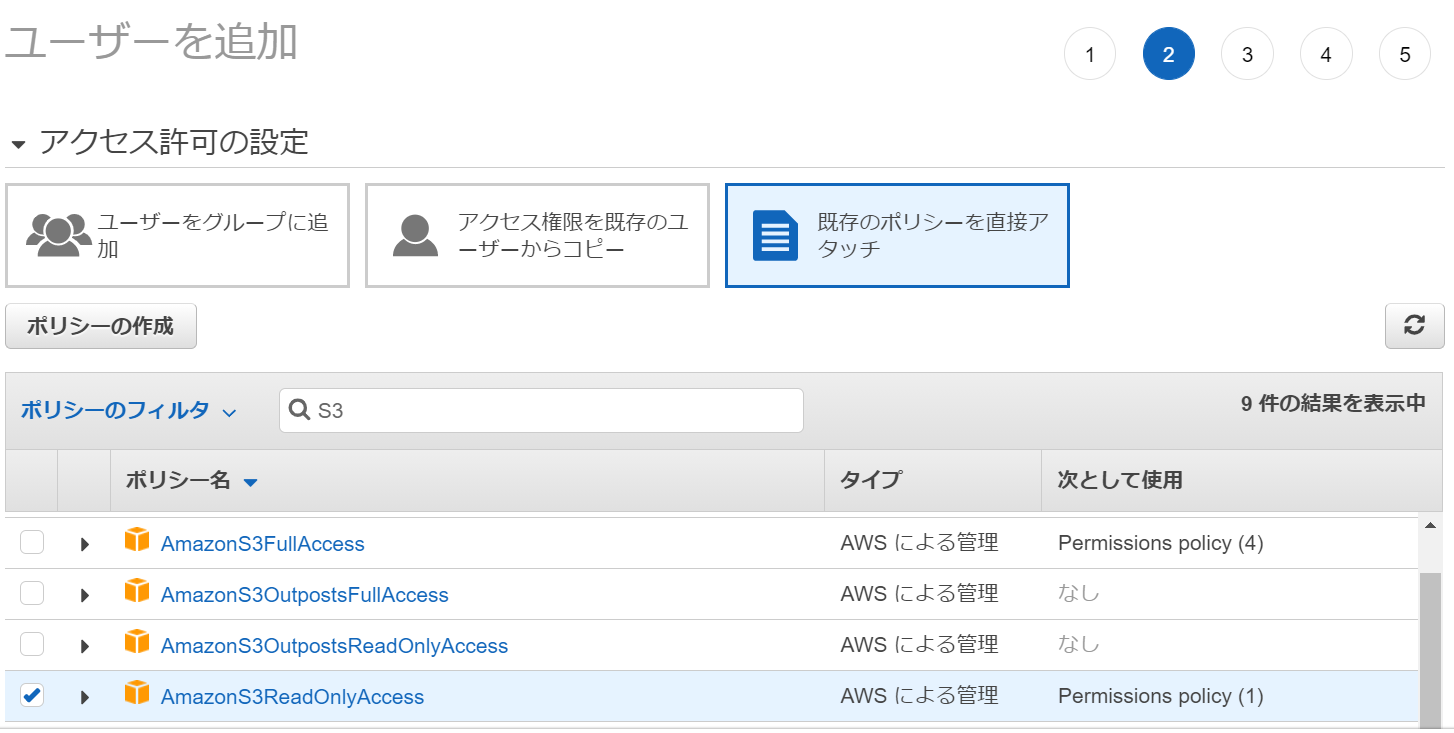
③Select the [AmazonS3ReadOnlyAccess] policy
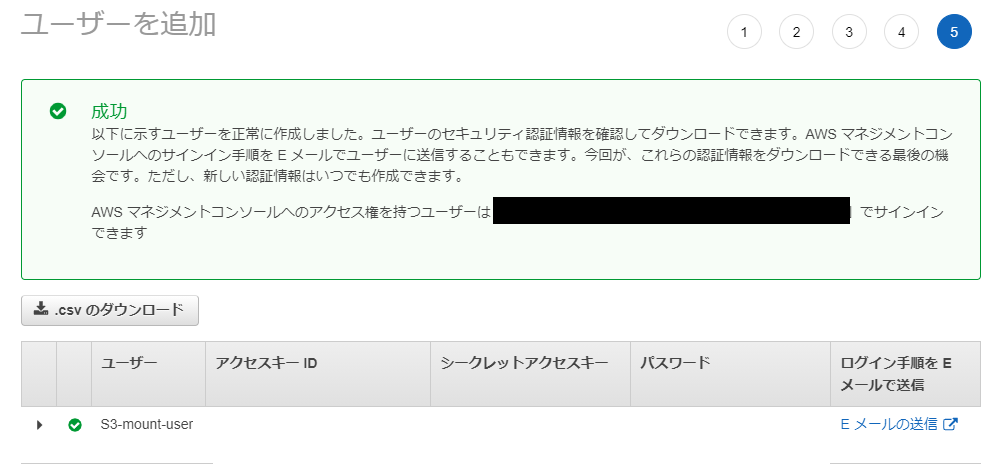
④ Check that there are no input errors and create a user
⑤Download the csv file
*Just in case, make a note of your access key and secret access key
⑥Install AWS CLI
* For information on installing the AWS CLI, please refer to the official AWS documentation
⚠This guide uses CentOS 7.
If you are using Amazon Linux 2, it is already installed, so no installation is necessary.
⑥-① Verify that Python version 2.7 or later is installed.
*If Python is not installed, please install it separately.
*On CentOS 7, version 2.7.5 is installed by default.
python --version Python 2.7.5
⑥-② Install the bundled installer
curl "https://s3.amazonaws.com/aws-cli/awscli-bundle.zip" -o "awscli-bundle.zip" sudo yum install -y unzip unzip awscli-bundle.zip sudo ./awscli-bundle/install -i /usr/local/aws -b /usr/local/bin/aws aws --version
⑦Configuring AWS CLI
aws configure AWS Access Key ID [None]: Enter the access key of the IAM you created AWS Secret Access Key [None]: Enter the secret key of the IAM you created Default region name [None]: Enter the region Default output format [None]: Enter the file format you want to output
⑧ Output access logs
*List files in the S3 bucket using the AWS CLI S3 command aws s3 ls s3://tokuhara-test-alb-access-log/AWSLogs/485076298277/elasticloadbalancing/ap-northeast-1/2021/01/18/ 2021-01-18 08:05:12 884 485076298277_elasticloadbalancing_ap-northeast-1_app.tokuhara-test-alb.20a1e21abd53f9e7_20210118T0805Z_54.65.29.6_53o3j7p0.log.gz *Copy locally aws s3 cp s3://tokuhara-test-alb-access-log/AWSLogs/485076298277/elasticloadbalancing/ap-northeast-1/2021/01/18/485076298277_elasticloadbalancing_ap-northeast-1_app.tokuhara-test-alb.20a1e21abd53f9e7_20210118T2355Z_52.68.106.116_5qgag1lu.log.gz ./ *Check if it has been copied locally ls -l ./ -rw-r--r--. 1 root root 295 Jan 18 23:55 485076298277_elasticloadbalancing_ap-northeast-1_app.tokuhara-test-alb.20a1e21abd53f9e7_20210118T2355Z_52.68.106.116_5qgag1lu.log.gz *Unzip the compressed file gunzip 485076298277_elasticloadbalancing_ap-northeast-1_app.tokuhara-test-alb.20a1e21abd53f9e7_20210118T2355Z_52.68.106.116_5qgag1lu.log.gz *View the access log less 485076298277_elasticloadbalancing_ap-northeast-1_app.tokuhara-test-alb.20a1e21abd53f9e7_20210118T2355Z_52.68.106.116_5qgag1lu.log http 2021-01-21T00:10:51.821814Z app/tokuhara-test-alb/20a1e21abd53f9e7 63.143.XX.XX:45662 - -1 -1 -1 503 - 110 337 "GET http://example.com:80/ HTTP/1.1" "Go-http-client/1.1" - - arn:aws:elasticloadbalancing:ap-northeast-1:485076298277:targetgroup/tokuahra-test-tg-ec2/ee1e50320f3398ec "Root=1-6008c68b-4198b51b343e8f127df30e01" "-" "-" 0 2021-01-21T00:10:51.821000Z "forward" "-" "-" "-" "-" "-" "-"
Output and Format
ELB access log settings!! Great job! ٩(ˊᗜˋ*)و
However, even if you set up access logs to be output, you can't investigate the cause if you don't know how to interpret them....
Therefore! Referring to the official AWS documentation, I have prepared the following format, which clearly shows the values and explanations corresponding to each item in a sample access log obtained from ELB . Please take a look to see what items are included!
http 2021-01-21T00:10:51.821814Z app/tokuhara-test-alb/20a1e21abd53f9e7 63.143.XX.XX:45662 - -1 -1 -1 503 - 110 337 "GET http://example.com:80/ HTTP/1.1" "Go-http-client/1.1" - - arn:aws:elasticloadbalancing:ap-northeast-1:485076298277:targetgroup/tokuahra-test-tg-ec2/ee1e50320f3398ec "Root=1-6008c68b-4198b51b343e8f127df30e01" "-" "-" 0 2021-01-21T00:10:51.821000Z "forward" "-" "-" "-" "-" "-" "-"
| field | explanation | Sample Values |
| type | The type of request or connection | http |
| time | The time (UTC) when the load balancer received the request from the client | 2021-01-21T00:10:51.821814Z |
| elb | The name of the ELB | app/tokuhara-test-alb/20a1e21abd53f9e7 |
| client:port | The IP address and port of the client that sent the request | 63.143.XX.XX:45662 |
| target:port | The IP address and port of the target that handled this request | - |
| request_processing_time | The total time elapsed from when the ELB receives the request to when it sends the request to the target | -1 |
| target_processing_time | The total time elapsed from when the ELB sent the request to the target until the target started sending the response headers | -1 |
| response_processing_time | The total time elapsed from when the ELB received the response header from the target to when it started sending the response to the client | -1 |
| elb_status_code | Status code of the response from the load balancer | 503 |
| target_status_code | The status code of the response from the target | - |
| received_bytes | The size of the request received from the client | 110 |
| sent_bytes | The size of the response returned to the client | 337 |
| "request" | The line is enclosed in double quotes in the client request | "GET http://example.com:80/ HTTP/1.1" |
| "user_agent" | A User-Agent string that identifies the client making the request | "Go-http-client/1.1" |
| ssl_cipher | SSL ciphers, set to - if not HTTPS | - |
| ssl_protocol | SSL protocol, set to - if not HTTPS | - |
| target_group_arn | The Amazon Resource Name of the target group | arn:aws:elasticloadbalancing:ap-northeast-1:485076298277:targetgroup/tokuahra-test-tg-ec2/ee1e50320f3398ec |
| "trace_id" | The contents of the X-Amzn-Trace-Id header (enclosed in double quotes) | "Root=1-6008c68b-4198b51b343e8f127df30e01" |
| "domain_name" | The SNI domain provided by the client during the TLS handshake (enclosed in double quotes). Set to - if not HTTPS | "-" |
| "chosen_cert_arn" | The ARN of the certificate to be presented to the client (enclosed in double quotes), set to - if not HTTPS | "-" |
| matched_rule_priority | The priority value of the rule that matched the request | 0 |
| request_creation_time | The time when the ELB received the request from the client | 2021-01-21T00:10:51.821000Z |
| "actions_executed" | Actions to be performed when processing the request (enclosed in double quotes) | "forward" |
| "redirect_url" | The redirect target URL in the HTTP response's Location header (enclosed in double quote characters) | "-" |
| "error_reason" | The error reason code (enclosed in double quotes) | "-" |
| "target:port_list" | A space-separated list of target IP addresses and ports (enclosed in double quotes) that handled this request | "-" |
| "target_status_code_list" | A space-separated list of status codes from the target response (enclosed in double quotes) | "-" |
| "classification" | The desync mitigation classification (enclosed in double quotes) | "-" |
| "classification_reason" | The classification reason code (enclosed in double quotes) | "-" |
Fee
Regarding pricing, ELB charges will apply.
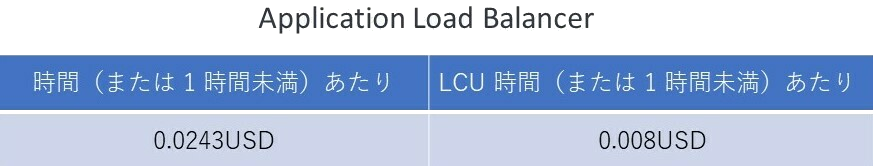
According to the official AWS documentation on ELB,
the usage fees for Application Load Balancers in the AWS Tokyo region are as follows:
Next, since the access logs are stored in S3 after being retrieved, S3 charges will be incurred.
According to the official AWS documentation regarding S3,
the pricing for S3 in the AWS Tokyo region is as follows:

It's a little confusing, but for the first 50 TB, you'll be charged $0.023 per GB per month
For example, if 10GB of log files are accumulated in a month, the first month will cost approximately 24.28 yen,
the second month will cost approximately 48.56 yen as 20GB is accumulated, and
the third month will cost approximately 72.54 yen as 30GB is accumulated.
Furthermore, a charge of 0.022 USD per GB will be incurred from the month the capacity exceeds 450TB.
Looking at the pricing calculations like this, you can see that it is possible to obtain access logs at a very low cost
summary
How was it?
Were you able to aggregate access logs very easily?
Enabling ELB access logs consolidates access logs, saving time and effort, and
ensuring stable use with virtually no log acquisition failures due to malfunctions!
Even if a server issue causes log defects, it can be easily investigated!
Therefore, be sure to enable ELB access logs
to ensure safe and convenient server operation!
Finally, if you're reading this and have become interested in S3,
please check out the article written by Beyond's Persian Cat!!
Thank you for reading the article!
 00
00 The person who wrote this article
About the author