[Access Analysis Tool] About QA Analytics [WordPress Plugin]
![]()
table of contents
This is Ohara from the Technical Sales Department
It has been announced that the current Google Analytics (Universal Analytics = UA) will be discontinued on July 1, 2023, and that users will need to migrate to its successor service, Google Analytics 4 (GA4)
▼ Below is the official Google page. ▼
◆ Introducing Google Analytics 4 (GA4)
Starting July 1, 2023, data will no longer be processed in standard Universal Analytics properties. You will still be able to view Universal Analytics reports for a period of time after July 1, 2023, but new data will only be sent to Google Analytics 4 properties
However, the successor service, Google Analytics 4 (GA4), is significantly different in usability from the previous version of Google Analytics (Universal Analytics = UA), and there have been many opinions and comments such as the following:
・The new GA4 is a different access analysis tool from the previous UA.
・It required relearning access analysis tools from scratch, which resulted in high learning costs.
・It was simply difficult to operate and configure GA4, and I didn't know how to use the console.
we will introduce the features and functions of QA Analytics , an access analysis and user behavior analysis tool that is gaining popularity and adoption by a growing number of users as the "post-Google Analytics
*This article contains information as of September 2022
QA Analytics Features
QA Analytics is characterized by being easy to read, easy to understand, and inexpensive
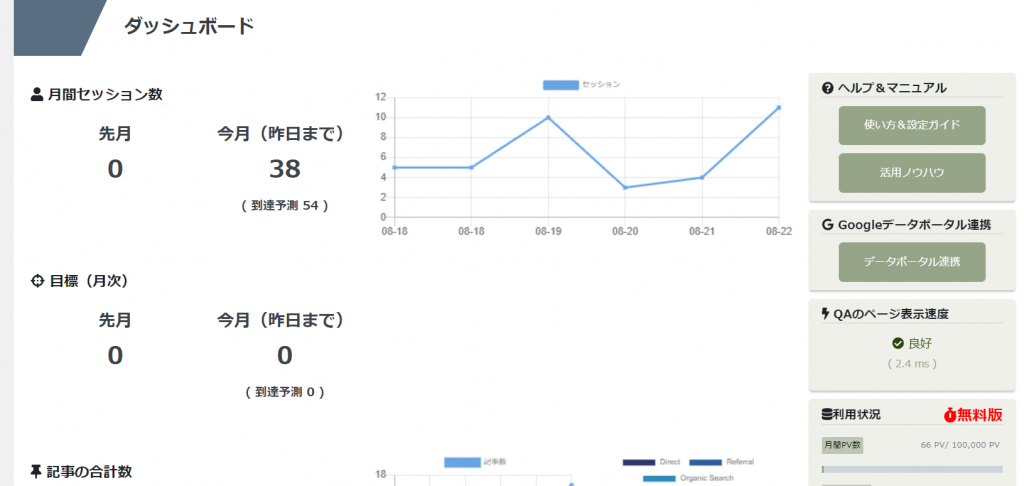
● Simple and fast access analysis report
- Analyze access using the WordPress admin screen, allowing you to rewrite articles as soon as you notice any issues.
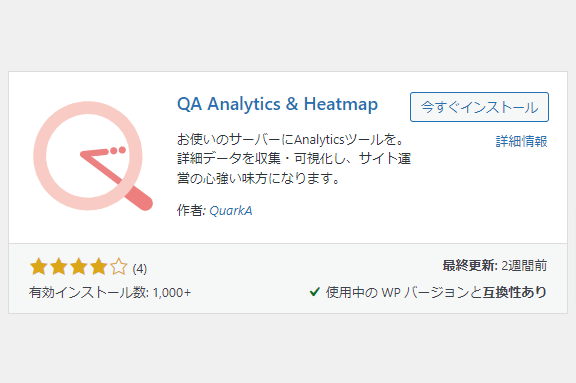
● Easy, no tags required No complicated settings required
- Installation can be completed in just two steps. No need for tedious tag installation or complicated settings.
● Visually check user behavior
- Understand user behavior not only with numbers but also with heat maps and session replays.
Key Features of QA Analytics
The functions of QA Analytics can be broadly divided into two categories: "analytics functions" and "data and creative improvement functions."
[Analytics function]
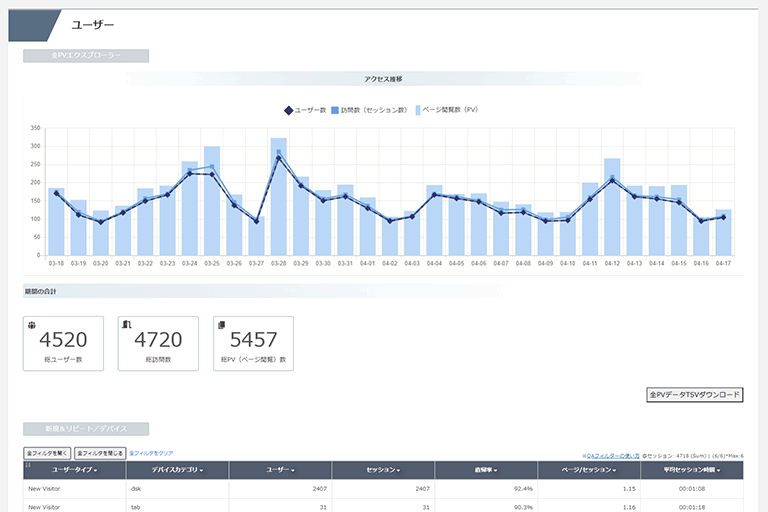
● Various analytics reports
・Session reports narrowed down to new/repeating users, etc.
・Session reports narrowed down to customer acquisition channels
・Session status reports for pages accessed by users
・Understanding the growth rate of landing pages
・Reports to understand the access status of conversion pages
・All PV data can be downloaded
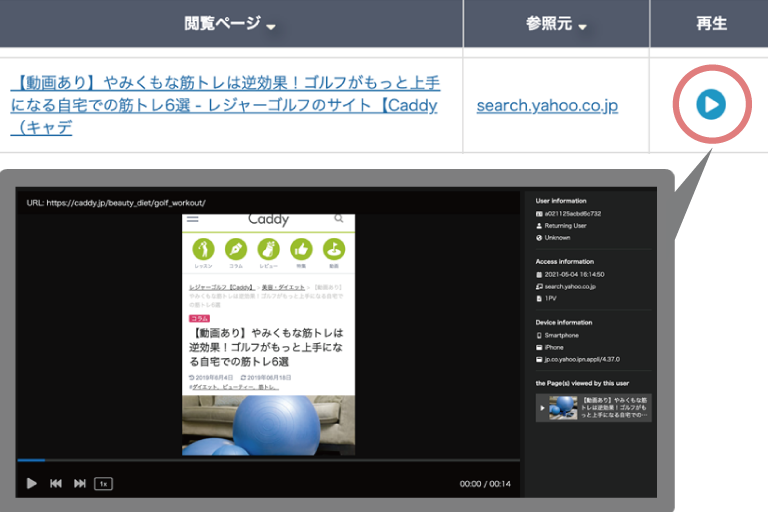
● Real-time recording and playback
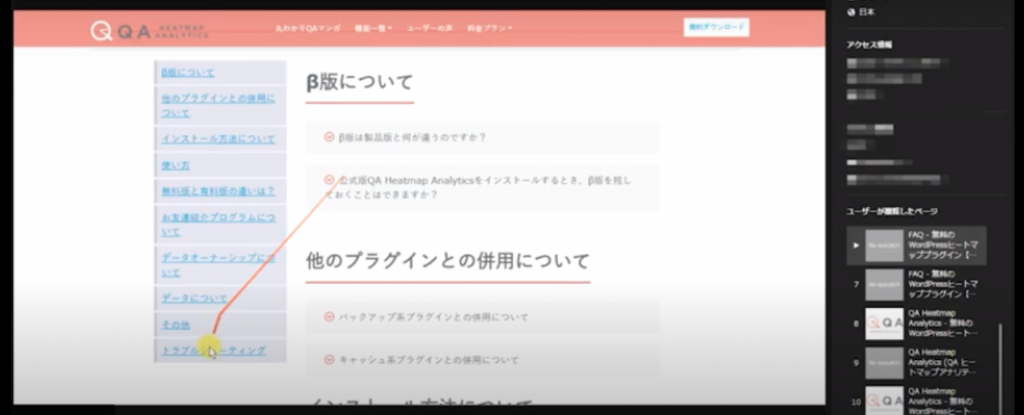
・You can play back real-time recordings (session replays) of visitors from 30 minutes ago. This function tracks the user's gaze and shows which part of which page the user is looking at. By observing the speed of scrolling and up and down movements, you can easily understand the user's emotions
[Data and creative improvement function]
● Heatmap
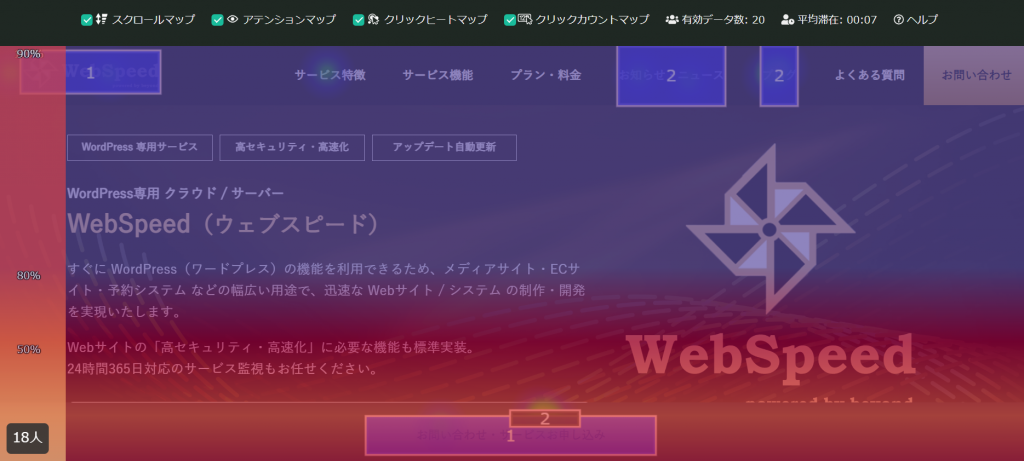
・Click heat map (where visitors clicked on the page)
・Attention map (where visitors were interested on the page)
・Scroll map (what percentage of people who visited the page and how many of them read to what extent)
・Click count map (how many buttons and links were pressed)
● Session replay (recording playback)
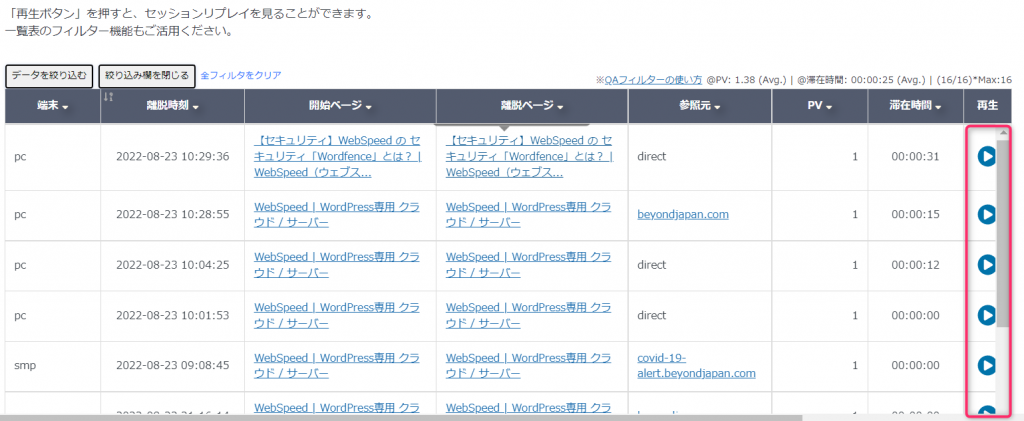
・Session replay (recorded playback) that allows you to watch videos of user behavior
・Download PV data by narrowing down the page/period, etc.
summary
My impression after using QA Analytics was that it was easy to read, easy to understand, and inexpensive
QA Analytics is available with a free plan, but if you choose the paid "Gold Pack Plan" and use all of its features, you can use it for an effective price of 2,750 yen/month (tax included)
If your website is created with WordPress, you can use it for free by simply installing a plugin available within WordPress, so why not give it a try?
 55
55 The person who wrote this article
About the author