Aggregating data from a specific period from a CSV file using Python [pandas]

table of contents
Hello.
I'm Kawa from the System Solutions Department. I have strong dreams but a weak personality.
It's getting warmer, isn't it?
So, this time I'll be using pandas, a basic Python data analysis library,
to aggregate a large amount of data from a CSV file.
environment
Operating system: Microsoft Windows 10 Pro
Python version: 3.10.4
big picture
import pandas as pd from datetime import datetime as dt import collections import itertools df = pd.read_csv('<filename>.csv', usecols=['datetime', 'person_in_charge'], encoding='cp932' ) df_date = df.set_index('datetime') #For error checking def check(x): #print(x) pd.to_datetime(x) df_date.index.map(check) df_date.index=pd.to_datetime(df_date.index,format='%Y%m%d %H:%M') df_date.sort_index(inplace=True) df_date['count'] = 1 df_multi = df_date.set_index([df_date.index.year, df_date.index.month, df_date.index.weekday, df_date.index.hour, df_date.index]) df_multi.index.names = ['year', 'month', 'weekday', 'hour', 'date'] df_date['person_in_charge'] = df_date['person_in_charge'].str.split(',') all_tag_list = list(itertools.chain.from_iterable(df_date['person_in_charge'])) c = collections.Counter(itertools.chain.from_iterable(df_date['person_in_charge'])) tags = pd.Series(c) df_tag_list = [] top_tag_list = tags.sort_values(ascending=False).index[:11].tolist() for t in top_tag_list: df_tag = df_date[df_date['person_in_charge'].apply(lambda x: t in x)] df_tag_list.append(df_tag[['count']].resample('1M').sum()) df_tags = pd.concat(df_tag_list, axis=1) df_tags.columns = top_tag_list df_tags.to_csv('result.csv', encoding='cp932') print("done")
Purpose and preparation
is assumed to contain a large amount of information
, including the dates when inquiries were received (yyyy/mm/dd format) and As a preprocessing step, the date column name is set to "datetime" and the person in charge name to "person_in_charge".
Since pandas is used as a library, it must be
installed from pip (For other environments such as Anaconda, see the link.)
Partial explanation
▼ Read the file with pandas. The csv file is in the same folder as the code file
df = pd.read_csv('<filename>.csv', usecols=['datetime', 'person_in_charge'], encoding='cp932' )
▼ Use df.set_index to assign the "datetime" column to the index.
*The latter part is just to check if there are any blank cells, so you can omit it.
df_date = df.set_index('datetime') def check(x): pd.to_datetime(x) df_date.index.map(check)
▼ Convert data type to datetime format & sort
df_date.index=pd.to_datetime(df_date.index,format='%Y%m%d %H:%M') df_date.sort_index(inplace=True) #Add a count column for resampling df_date['count'] = 1
※What is resampling? (External link)
▼ Grouping and counting by day or time
df_multi = df_date.set_index([df_date.index.year, df_date.index.month, df_date.index.weekday, df_date.index.hour, df_date.index]) df_multi.index.names = ['year', 'month', 'weekday', 'hour', 'date'] df_date['person_in_charge'] = df_date['person_in_charge'].str.split(',') all_tag_list = list(itertools.chain.from_iterable(df_date['person_in_charge'])) #Pass iterate to collection. Count the number of occurrences of each tag c = collections.Counter(itertools.chain.from_iterable(df_date['person_in_charge'])) #Convert to series tags = pd.Series(c)
※What is a series in pandas? (External link)
▼ Store tags in a DataFrame
df_tag_list = [] top_tag_list = tags.sort_values(ascending=False).index[:11].tolist()
▼ This is the key point. If you change the "'1M'" part of "df_tag_list.append(df_tag[['count']].resample('1M').sum())"
to "'2W'", you can aggregate data every two weeks, or "'7D'" to aggregate data every seven days.
for t in top_tag_list: df_tag = df_date[df_date['person_in_charge'].apply(lambda x: t in x)] df_tag_list.append(df_tag[['count']].resample('1M').sum()) df_tags = pd.concat(df_tag_list, axis=1) df_tags.columns = top_tag_list
▼ Output aggregated data to a new file
df_tags.to_csv('result.csv', encoding='cp932') #When finished, print "done" print("done")
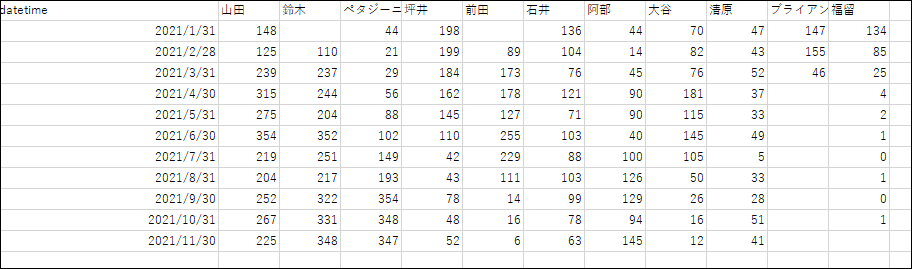
Output results
Here it is:
the monthly summary data for each person in charge is complete. You can also summarize it by week or day as needed, and
with some clever styling, you can even use it as data in meetings!
See you later!
 66
66 The person who wrote this article
About the author