Starting Wireshark from scratch

table of contents
Hello.
I accidentally sent `echo "" > /etc/passwd`. This is Kawa from the System Solutions Department.
This time, I'd like to write about Wireshark, which I introduced in a previous article about networking tools . By the way, my favorite shark movie is Deep Blue Sea .
What is Wireshark?
This is a well-known tool that's practically essential for network engineers.
Compatible with both Windows and macOS, it essentially captures packets on the installed PC and visualizes them incredibly easily. It's
frequently used for network investigations during troubleshooting.
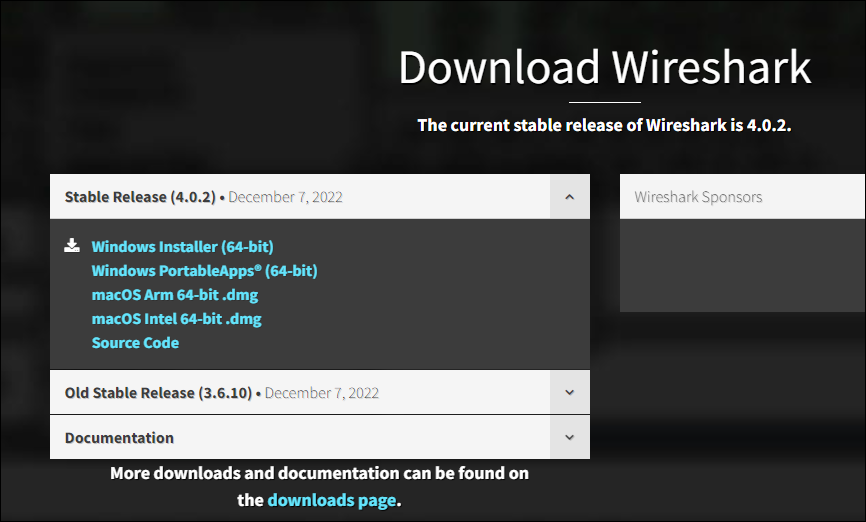
Download and installation
Download the software by clicking on the file name corresponding to your operating system in the "Download" section of the official website ( https://www.wireshark.org/ )
Once downloaded, open the executable file and follow the installer's instructions, clicking "Next" each time.
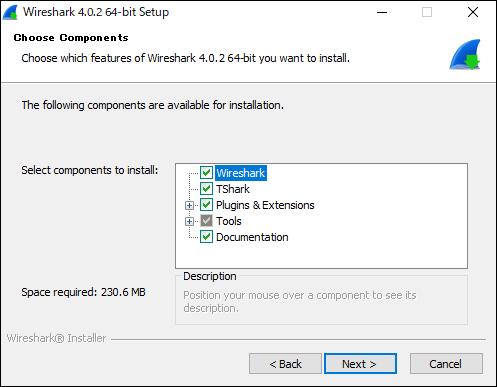
(The default settings are generally fine for the items listed above.)
Once the installation is complete, open Wireshark, and if you see a screen similar to the one below, you're done.
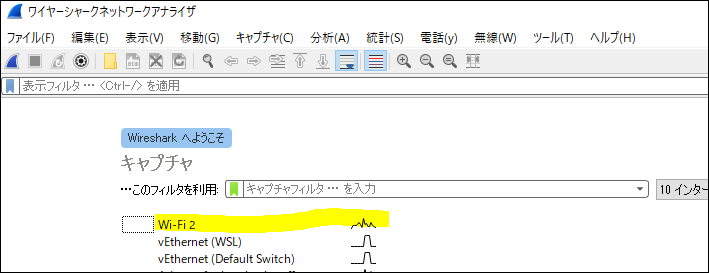
Double-click the network adapter with the squiggly waveform to view the capture of the main interface you're connected to.
How to view Windows capture data
When you select an interface, captured inbound/outbound packets immediately start flowing in (IP information and other details have been blurred out) ⬇.
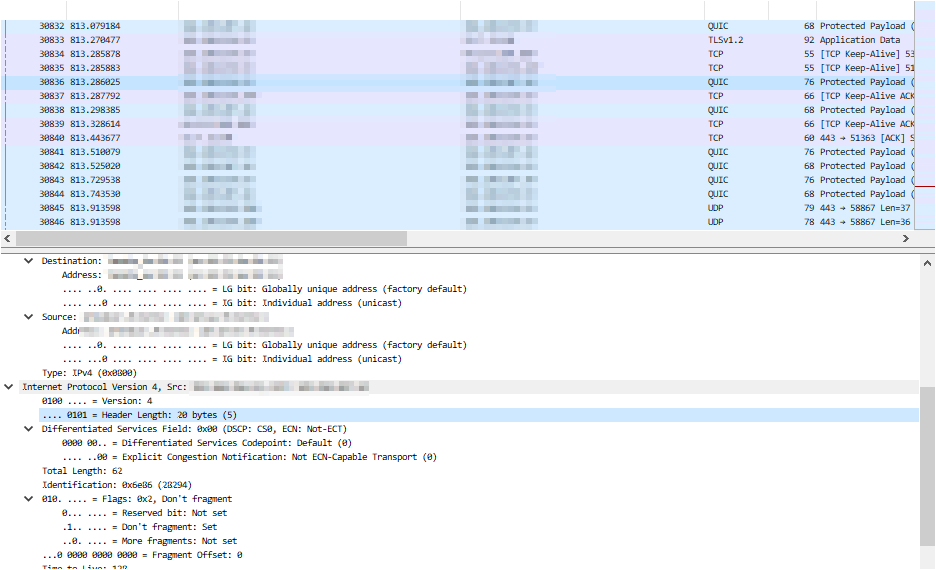
It's all rather confusing, isn't it?
Let's try sending a ping to our website (beyondjapan.com) from the command prompt
> ping beyondjapan.com
Enter "icmp" in the search box at the top and press Enter.

The ping results will be sorted, and you will be able to see ICMP packets destined for our website.
Right-click on the text at the bottom and select "Expand All" to see the contents of the packet.
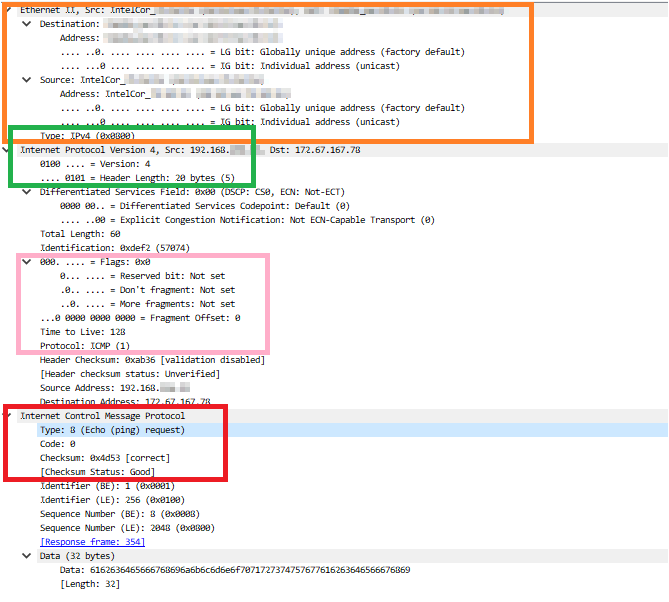
Orange section: Source/destination address, router model and MAC address, etc.
Green section: IP version (v4 in this case and header length)
Pink section: Flags, TTL and protocol
Red section: ICMP type and checksum
In this case, since it is ICMP, the information available is not very rich, but as long as the packet is not encrypted, you can see detailed data such as the payload (abuse is strictly prohibited)
Incidentally, if you look at the famous Hiroshi Abe's HTTP site, it's obvious where you accessed.
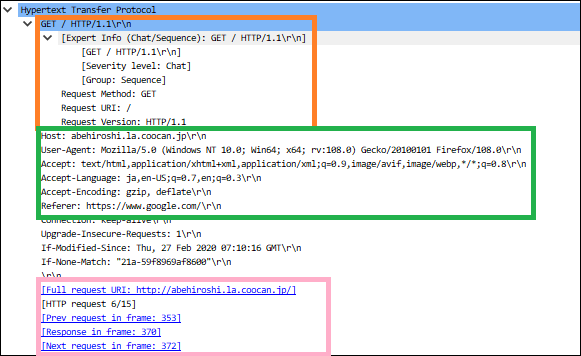
Orange section: Request method and HTTP version
Green section: Host information, browser user agent information, language, referrer, etc.
Pink section: Accessed URL, frame number associated with the series of accesses
When using HTTP sites, you need to be especially careful aboutthe information you enter into forms.
If you send passwords or other sensitive information through an unencrypted form, the password string can be detected through packet capture.
(This is why connecting to public Wi-Fi networks is not a good idea.)
Filters
We will use Wireshark syntax for the search.
This time, I will introduce some commonly used notations. Since various writing styles, including regular expressions, are possible, it seems that this could also be useful for troubleshooting when interacting with APIs.
- Filter by IP address
ip.addr == xx.xx.xx.xx !(ip.addr==xx.xx.xx.xx) #Exclude specific IP
Let's try sending a ping to "1.1.1.1" and search for the results.
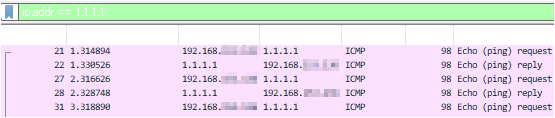
You can see the ping request → reply exchange.
- Filter by port number
tcp.port == xx udp.port == xx tcp.port == xx || udp.port == xx #Multiple searches with or !(tcp.port == xx) #Exclude specific ports !(tcp.port==xx) && ip.addr==xx.xx.xx.xx #And condition
Let's try checking the TCP/443 communication.
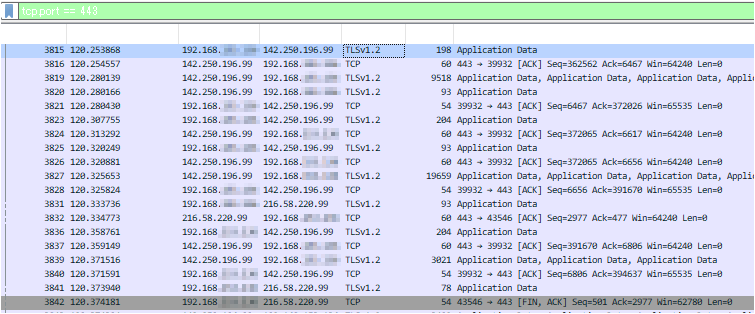
By looking up the IP address, we can see the flow of a Google search.
Looking at the explanation and flags in the "Info" section, we can see the TCP handshake exchange (ACK, FIN, etc.).
Packet capture on a Linux machine
If you have a PC with Wireshark installed, you can view packet capture files taken on a Linux machine
This time, we'll use tcpdump, which I introduced previously . (Please install tcpdump beforehand using yum or apt.)
This article uses Ubuntu to create a custom file and output captured data.
The data will be written to a file named "test.pcap" (pcap is the file extension for packet capture files).
*Use ifconfig or similar to identify and specify the interface name that is not connected to the internet.
> tcpdump -i ens33 -w test.pcap
Capture continues until you cancel it, so use this time to generate the communication you want to check (browser access, etc.).
Terminate tcpdump with "Ctrl+C" and transfer the output file to your Windows/macOS machine.
Opening the extracted pcap file with Wireshark will visualize the captured data.

↑A niceChristmas scanpacket is visualized (don't try this at home, kids).
The strength of Wireshark is that anyone can easily capture packet flow as long as they know how to read it
In addition to capturing packets from your PC, you can also capture all packets flowing through the local network by using a switch and creating a mirror port, making it a frequently used software in real-world applications. It's also a great way to
learn about TCP/IP, so I highly recommend installing it.
 1010
1010 The person who wrote this article
About the author