Network/security investigation commands/tools

table of contents
Hello.
I'm Kawa from the System Solutions Department and I have a critical collarbone.
Recently, it has become commonplace for everything to be moved to the cloud, but there are times when I suddenly realize that technologies that were born on the basis of physical networks are still being used as a matter of course even in a cloud environment
For example, when determining the range of a subnet, when there is no ping response from a server, when you want to check if a port is open, etc., all of these are parts of a cloud service that you can normally configure without even thinking about it, but they all require knowledge of networks
So, this time I would like to introduce some commands and tools that can be used for network investigations, etc
Operating environment
Operating system: Ubuntu 18.0.4
*The following tools have been confirmed to work on CentOS 7.9. Please replace "yum" with "yum" when installing.
Communication check, network test tool "hping3"
apt install hping3
It goes without saying that this is a command-based network investigation/test tool .
It can be used for network testing, etc., by sending ICMP, TCP/UDP packets with any flags set, and specifying the data size. Of course, misuse is strictly prohibited.
■Command example
▼Send a single ping without thinking
hping3 -c 1 1.1.1.1 HPING 1.1.1.1 (ens33 1.1.1.1): NO FLAGS are set, 40 headers + 0 data bytes --- 1.1.1.1 hping statistic --- 1 packets transmitted, 0 packets received, 100% packet loss round-trip min/avg/max = 0.0/0.0/0.0 ms
▼ Send one SYN packet to TCP/443, source port TCP/8080, and the default gateway
hping3 --traceroute -V -S -c 1 -p 443 -s 8080 10.0.0.1 using ens33, addr: 10.0.0.10, MTU: 1500 HPING 10.0.0.1 (ens33 10.0.0.10): S set, 40 headers + 0 data bytes hop=1 TTL 0 during transit from ip=10.0.0.2 name=_gateway hop=1 hoprtt=4.0 ms --- 10.0.0.1 hping statistic --- 1 packets transmitted, 1 packets received, 0% packet loss round-trip min/avg/max = 4.0/4.0/4.0 ms
You can see that there was a response from port 443
▼It can also be used as a security check. In the example below, a SYN scan is performed on ports TCP1-100 addressed to 10.0.0.1
hping3 -S -8 1-100 10.0.0.1 Scanning 10.0.0.1 (10.0.0.1), port 1-100 100 ports to scan, use -V to see all the replies +----+----------+---------+---+-----+-----+-----+ |port| serv name | flags |ttl| id | win | len | +----+-----------+---------+---+-----+-----+-----+ 22 ssh : .S..A... 128 13078 64240 46 80 http : .S..A... 128 13590 64240 46 All replies received. Done. Not responding ports: (1 tcpmux) (2 nbp) (3 ) (4 echo) (5 ) (6 zip) (7 echo) (8 ) (9 discard) (10 ) (11 systat) (12 ) (13 daytime) (14 ) (15 netstat) (16 ) (17 qotd) (18 msp) (19 chargen) (20 ftp-data) (21 ftp) (23 telnet) (24 ) (25 smtp) (26 ) (27 ) (28 ) (29 ) (30 ) (31 ) (32 ) (33 ) (34 ) (35 ) (36 ) (37 time) (38 ) (39 rlp) (40 ) (41 ) (42 nameserver) (43 whois) (44 ) (45 ) (46 ) (47 ) (48 ) (49 tacacs) (50 re-mail-ck) (51 ) (52 ) (53 domain) (54 ) (55 ) (56 ) (57 ) (58 ) (59 ) (60 ) (61 ) (62 ) (63 ) (64 ) (65 tacacs-ds) (66 ) (67 bootps) (68 bootpc) (69 tftp) (70 gopher) (71 ) (72 ) (73 ) (74 ) (75 ) (76 ) (77 ) (78 ) (79 finger) (81 ) (82 ) (83 ) (84 ) (85 ) (86 ) (87 link) (88 kerberos) (89 ) (90 ) (91 ) (92 ) (93 ) (94 ) (95 supdup) (96 ) (97 ) (98 linuxconf) (99 ) (100 )
You can see that there was a SYN-ACK response from the port that responded (SSH, HTTP). You can also see if any unnecessary ports are open
A slightly stronger version of traceroute: "mtr"
An advanced version of traceroute used for route investigation
apt install mtr
▼Basic form. Unlike normal traceroute, it also displays the average/max/min response speed along the route, which is useful for troubleshooting. You can also send at any interval using the "-i" option (default is 1 second)
mtr -t 1.1.1.1 hostname (10.0.0.10) Keys: Help Display mode Restart statistics Order of fields quit Packets Pings Host Loss% Snt Last Avg Best Wrst StDev 1. _gateway 0.0% 17 0.4 0.5 0.4 1.0 0.1 ... 10. one.one.one.one 0.0% 16 14.6 13.8 12.1 16.1 1.2
▼You can also use TCP with "-T" and UDP packets with "-u"
mtr -T -t 1.1.1.1 mtr -u -t 1.1.1.1
▼ After running in the background with the "-r" option, only the results will be displayed
mtr -r beyondjapan.com Start: 2022-10-11T14:15:33+0900 HOST: hostname Loss% Snt Last Avg Best Wrst StDev 1.|-- _gateway 0.0% 10 0.5 0.5 0.4 0.6 0.1 2.|-- ??? 100.0 10 0.0 0.0 0.0 0.0 0.0
I lost it along the way
A handy ARP command "arp-scan"
apt install arp-scan
The ARP command often used in physical networks , but it can be used to check hosts on the same network and generate a list including MAC addresses. arp-scan is also useful because it displays vendor information.
arp-scan -l Interface: eth0, type: EN10MB, MAC: 00:15:5d:e1:28:70, IPv4: 192.168.80.77 Starting arp-scan 1.9.7 with 4096 hosts (https://github.com/royhills/arp-scan) 192.168.80.1 00:15:5d:8f:b3:18 Microsoft Corporation
The gold standard for network/security tools: "nmap"
nmap
is primarily used for port scanning. It is a tool that can be used to investigate ports that are unnecessarily open on internal servers. While this is not a problem internally, it can become a security hole on publicly accessible servers, so using such tools to investigate can also help improve security (of course, misuse is strictly prohibited. Please use it correctly and follow the instructions for use).
apt install nmap
▼Check if TCP/80 is open
nmap -p 80 10.0.0.1 Starting Nmap 7.60 ( https://nmap.org ) at 2022-10-11 14:32 JST Nmap scan report for 10.0.0.1 Host is up (0.00042s latency). PORT STATE SERVICE 80/tcp filtered http ...
Since the State is "filtered", we can see that TCP/80 is not open
By specifying a hyphen in the port number part, you can check multiple ports at once. Because this performs a stealth scan, use of this command for third-party resources is strictly prohibited
tcpdump: A packet capture tool essential for network engineers
This is a standard packet capture tool .
the output file Wireshark or similar, you can view the captured packets in a GUI. Since the contents of unencrypted packets are visible, this tool is limited to use in a local environment.
apt install tcpdump
▼Basically, you specify a specific interface or host to capture. In this example, we specify the interface “ens33” and output to a file called “captured.pcap.”
tcpdump -i ens33 -w captured.pcap
After stopping the capture, you can check the contents by adding the following options:
tcpdump -r captured.pcap 14:46:33.494124 ARP, Request who-has _gateway tell 10.0.0.1, length 46 14:46:33.586828 IP 10.0.0.1.54475 > 239.255.255.250.1900: UDP, length 175 14:46:34.588083 IP 10.0.0.1.54475 > 239.255.255.250.1900: UDP, length 175
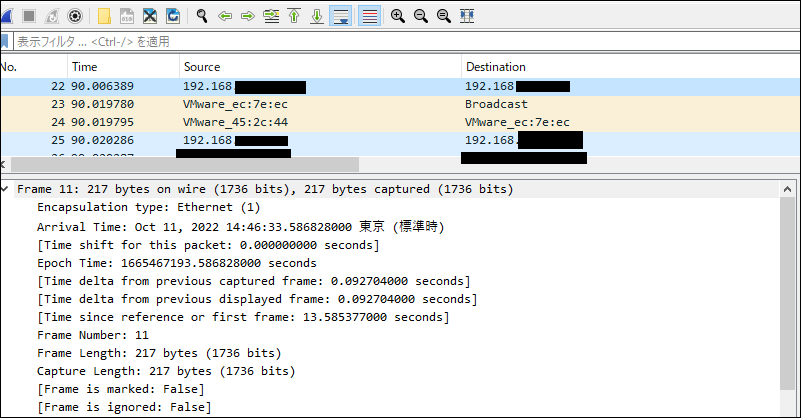
If you extract the file and put it into Wireshark, it will be displayed in color, making it easier to read, and you can easily sort it (I'd like to write an article about Wireshark someday)
Summary of the summary
This concludes our introduction to network/security related tools
At Beyond, we mainly use a cloud environment, so I don't really feel it, but there are some aspects that are difficult or impossible to completely migrate to the cloud, such as the internal network, remote work environment, guest Wi-Fi when customers visit, and internal security. The tools introduced here are definitely useful techniques for troubleshooting in a cloud environment, so I think it would be a good idea to take this opportunity to learn about them and get a feel for the changes :)
complete
 1111
1111 The person who wrote this article
About the author