How to check server load with load average and Linux process explained
2016.02.04
 2
2 
table of contents
I'm Ito, an infrastructure engineer.
One of the biggest challenges in server operation and maintenance is sudden increases in load.
, "The service is slow, but I don't know why!"
, I'd like to introduce you to "load average," which is often the first thing we check.
About load average
When a website or game is slow due to a high load, the first thing you'll likely do is use the `top` command.
The `top` command displays the current state of your operating system in real time.
It provides a lot of information, so you might not know where to start looking.
This time we are talking about load average, so let's check the load average
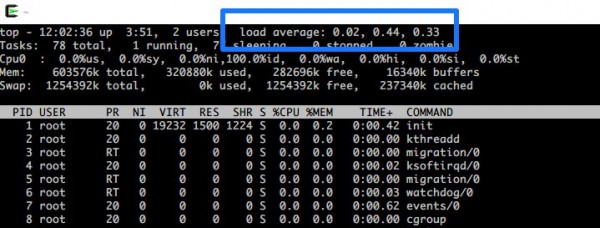
Load Average (LA) represents the "queue of processes" for the server and is typically displayed as an average value over periods such as 1 minute, 5 minutes, or 15 minutes
In the diagram above, from left to right, it shows "LA 1 minute ago," "LA 5 minutes ago," and "LA 15 minutes ago."
This describes a situation where various processes are requesting the CPU to process them, but the server cannot handle all of them, causing those processes to form a queue
The higher the load average, the more heavily loaded the server is
The number of processes a server can handle at once is determined by the number of CPU cores it has.
Because it can handle multiple tasks simultaneously, a server with four cores, for example, can handle four processes at once.
About Linux processes
Do you now have a rough understanding of load average?
Now let's talk about Linux processes, which also have different states
| TASK_RUNNING | The process is in a state where it can be executed, and is either running or waiting to be executed |
|---|---|
| TASK_INTERRUPTIBLE | Interrupts are possible, but it is unclear when the process will return, such as when waiting for user input |
| TASK_UNINTERRUPTIBLE | The server is overloaded and cannot be interrupted, so it is waiting |
| TASK_STOPPED | Aborted state |
| TASK_ZOMBIE | So-called zombie processes |
References:Process Management 1 - Process Descriptors - Pridact Information Sharing Wiki
;Learning How Linux Works - Process Management and Scheduling
Of these, the following three are not load-related conditions:
- TASK_INTERRUPTIBLE: This task is waiting for user input, so it is not queued because it is not known when it will return
- TASK_STOPPED: The process is stopped
- TASK_ZONBIE: Turned into a zombie
In other words, the remaining two enter a queue, which becomes the load average value and represents the "system load." These are the states where
"tasks are waiting to be executed (TASK_RUNNING)" and "the load is high and interruptions are not possible (TASK_UNINTERRUPTIBLE)."
- TASK_RUNNING
- TASK_UNINTERRUPTIBLE
Other commands that LA can check
Here are two other commands that can be used to check the load average
The w command allows you to see what other users are logged in
[root@test ~]# w 12:49:13 up 4:38, 2 users, load average: 0.00, 0.00, 0.00 USER TTY FROM LOGIN@ IDLE JCPU PCPU WHAT vagrant pts/0 10.0.2.2 11:43 0.00s 0.00s 0.00s sshd: vagrant [priv] vagrant pts/1 10.0.2.2 11:55 54:08 2.06s 0.00s sshd: vagrant [priv]
The `uptime` command allows you to check how long a server will continue to run.
You can also check the load average here.
[root@test ~]# uptime 12:49:34 up 4:38, 2 users, load average: 0.00, 0.00, 0.00
summary
So, this time I explained about load average!
- Check the load average when the load is high
- Find out how many processes your server can't handle
- The higher the load average, the higher the load
- Although it is called a "process," there are various states
- There are several commands to view the load average
It would be great if we could create a system that didn't require us to worry about such things, but it's still very important to know these values when operating a server, so make sure you understand them properly!
If you want to talk to a cloud professional
Since our founding, Beyond has used the technical capabilities we have cultivated as a multi-cloud integrator and managed service provider (MSP) to design, build, and migrate systems using a variety of cloud/server platforms, including AWS, GCP, Azure, and Oracle Cloud
We provide a custom-made cloud/server environment optimized for our customers based on the specifications and functions of the systems and applications they require, so if you are interested in the cloud, please feel free to contact us
● Cloud/Server design and construction
● Cloud/Server migration
● Cloud/Server operation, maintenance, and monitoring (24 hours a day, 365 days a year)
22 The person who wrote this article
About the author