"Appmill" is a simple, easy and smart website monitoring service

This is Nakagawa from the System Solutions Department.
The other day, Beyond's new content, "Appmill," was released in press!
For those of you who are new to Appmill or are unfamiliar with it,
a "simple, easy, and smart" website monitoring service .
With a simple registration process, we monitor your site to ensure it displays smoothly 24 hours a day, 365 days a year.
It is an easy-to-use service, even for those without specialized knowledge, as it displays errors and the status of your website using charts, graphs, and alert functions
If you would like to know more, please click here
, we will explain how to use
Appmill for those who want to use it, or for those who are interested but don't know how to use it It's easy to use in just three steps!
Start using Appmill
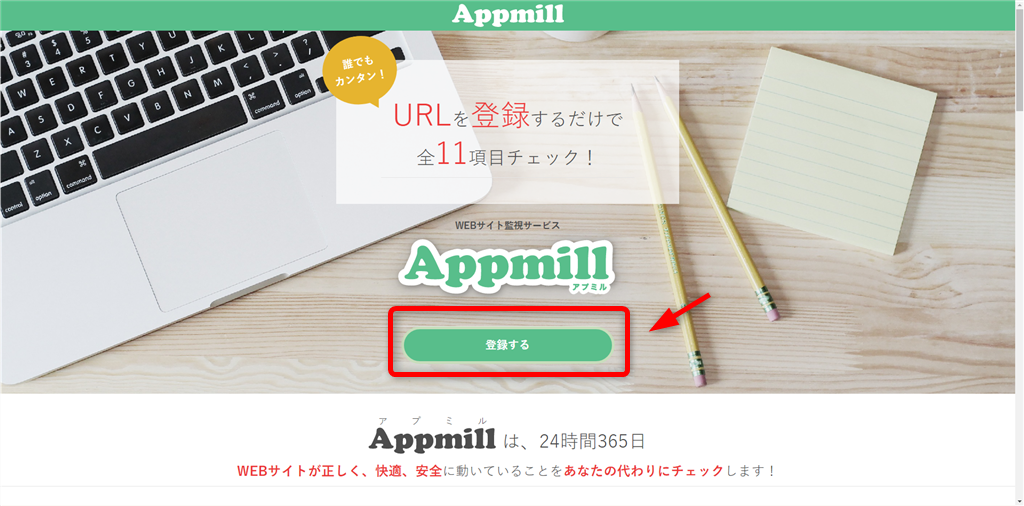
1. Access Appmill
Go to the link:
https://appmill.work
Click "Register" on the page
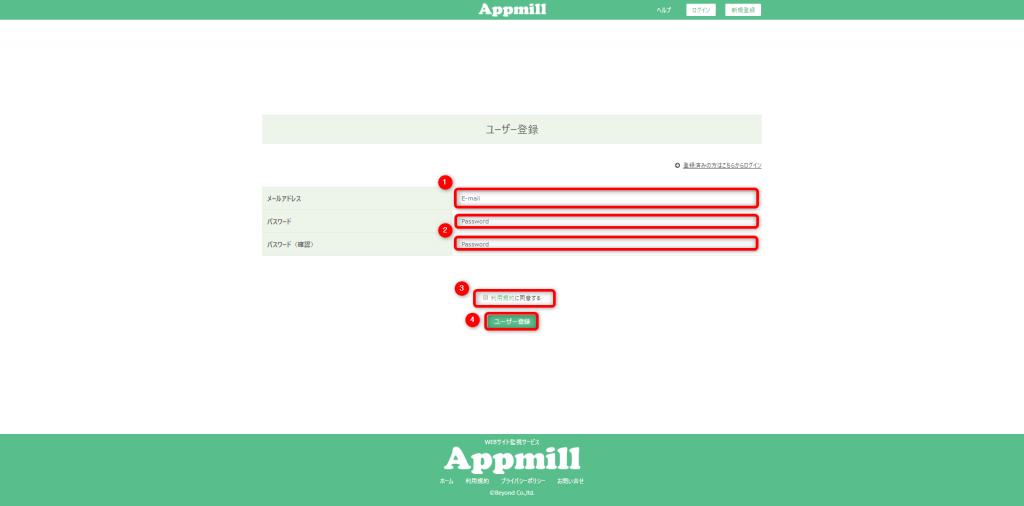
2. User Registration
Once you are redirected to the user registration screen, enter and select the following items:
1. Email address
2. Password/Confirm password
*Passwords must be at least 8 characters long and contain at least one letter and one number.
3. Check "I agree to the terms of use"
4. Click the "Register user" button
Once registration is complete, the following screen will be displayed.
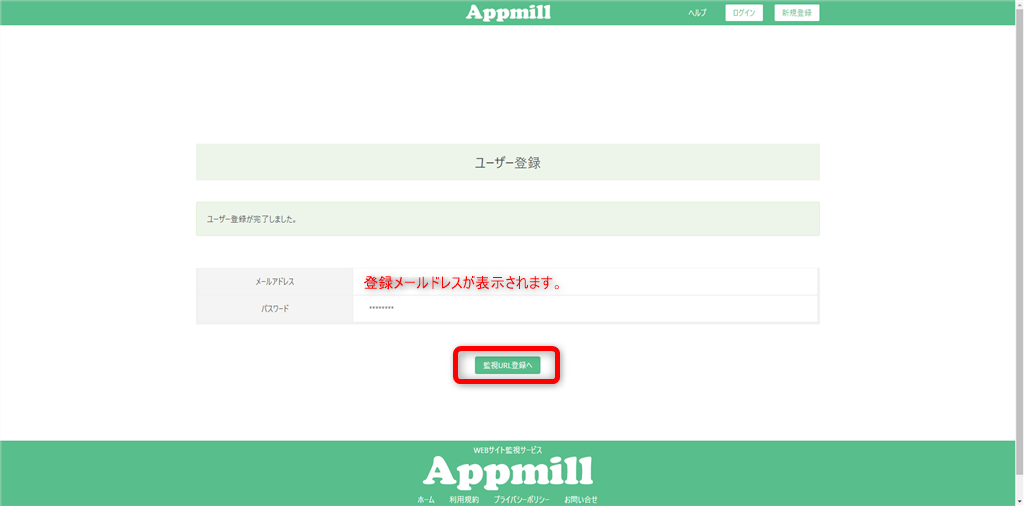
Congratulations on registering as a user!
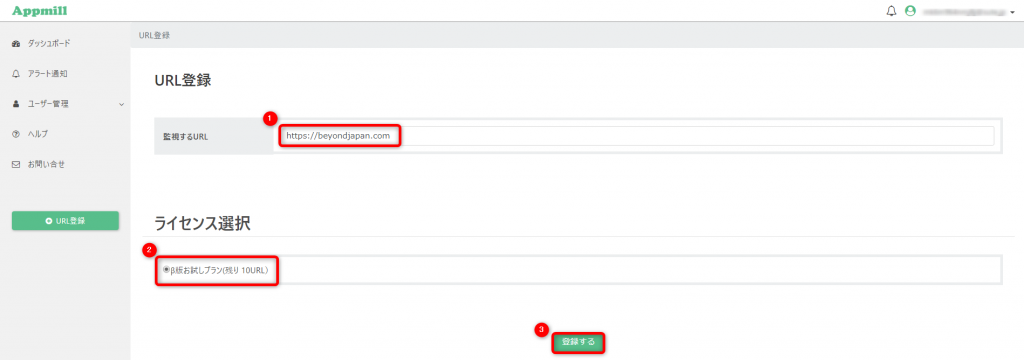
3. URL registration
Now, let's register the URL to be monitored.
1. On the URL registration screen, enter the URL to be monitored (here, enter https://beyondjapan.com/).
2. Select the radio button for license selection.
3. Click "Register."
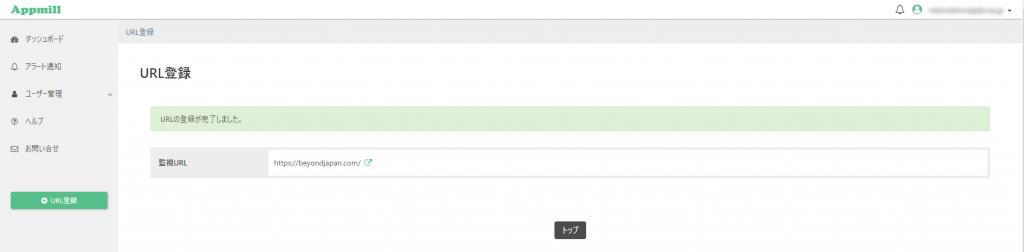
After registration, if the message "URL registration completed" is displayed, the registration was successful
 Congratulations!
You have now completed the process of using Appmill and registering URL monitoring.
Monitoring content and settings
Let's check the URLs you've registered.
The URLs you've registered for monitoring are displayed in the dashboard section of the management screen.
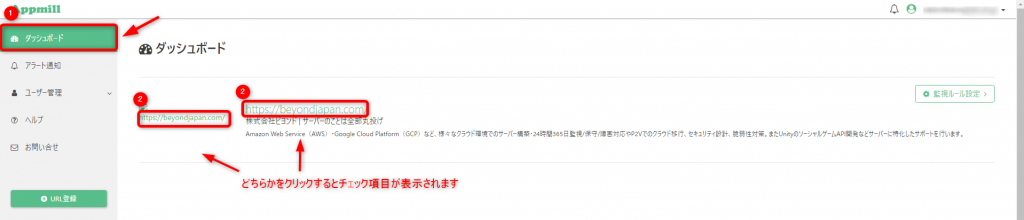
When you select the URL to be monitored, the following check items will be displayed.
・Site check = Is the site in a state where it cannot be viewed?
・Response time = Is the page displayed within 10 seconds of accessing the URL?
・Status code = Is a normal status code (200) returned?
The response time and status code are default settings, but can be changed.
To change the monitoring rule, click "Monitoring Rule Settings" for the target URL on the dashboard.
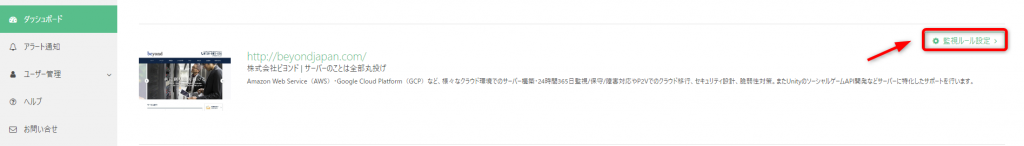
You can customize the settings such as timeout and status code to your liking
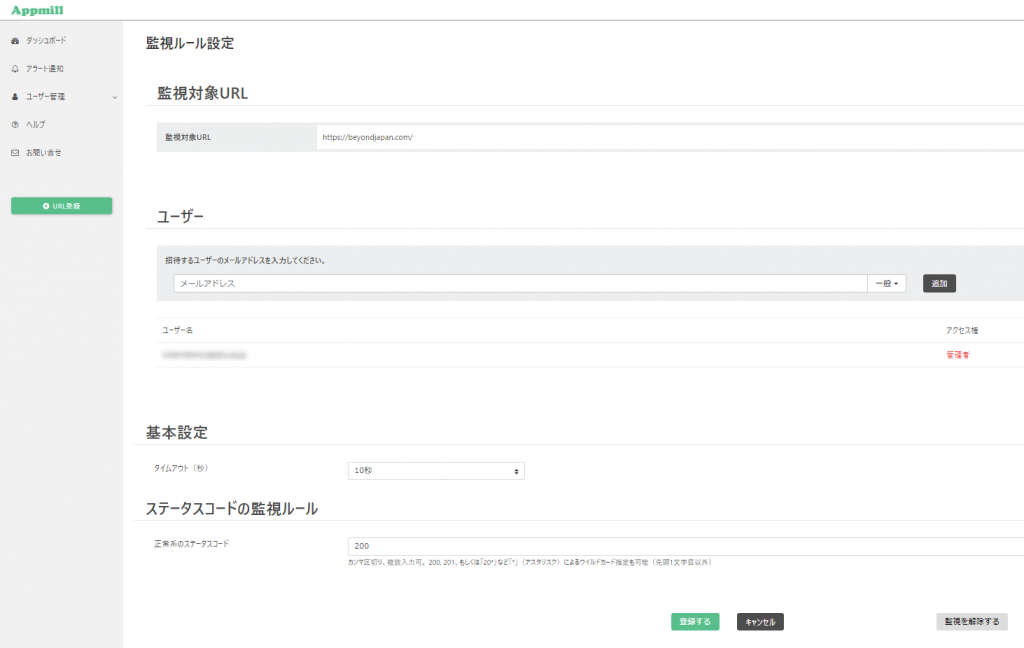
Also, if you accidentally registered the wrong URL
, don't worry, you can delete the monitoring from the monitoring rule settings.
In addition to the above,
it can also check for broken links, WordPress program errors, and other 11 other monitoring items.
If you're interested, please give it a try.
If you are considering server monitoring and support for
any server-related concerns , not just content, please feel free to contact us using
the icon in the bottom right or here We look forward to your use and inquiries.
 00
00 The person who wrote this article
About the author