[Containers] Kubernetes Infrastructure Monitoring with Datadog [Monitoring]
table of contents
This is Ohara from the Technical Sales Department
This article discusses infrastructure monitoring for Kubernetes environments using Datadog's monitoring tools. It
explores the key features and key points of the tool, addressing the question, "Why is an integrated monitoring tool necessary for a dynamic and variable infrastructure environment like Kubernetes?"
(Information current as of March 2022).
Challenges of infrastructure monitoring for Kubernetes environments
The adoption of orchestration systems like Kubernetes is increasing to improve infrastructure scalability and fault tolerance. However, unlike traditional cases where only static hosts used for a long time, such as virtual machines or physical machines, dynamic and complex embedded environments like Kubernetes require monitoring using an integrated monitoring tool like Datadog that can provide real-time visibility into hosts, containers, applications, and the entire Kubernetes environment
More components to monitor:
In traditional host-centric infrastructure, the two main layers to monitor are the application and the host running the application. In orchestrated environments, a new layer of abstraction is added: containers and Kubernetes themselves must be monitored to comprehensively track the infrastructure.
● Distributed applications are constantly moving
: Kubernetes constantly moves pods between hosts, scaling them up and down to meet demand. To properly understand your applications and their content, you need to monitor all pods and the applications running within them. However, because Kubernetes automatically schedules workloads, it can be difficult to continuously check where these pods are actually running.
Tags and labels are essential for continuous visibility.
A typical Kubernetes cluster has many dynamic and changing elements, so tags and labels are the only reliable way to identify pods and the applications within them. Without labels and tags, it would be nearly impossible to aggregate or interpret performance data from a constantly changing Kubernetes infrastructure.
Monitor Kubernetes platform environments at any scale
Kubernetes clusters run on a variety of platforms, and Datadog's 400+ pre-built integrations for all major cloud providers let you monitor the health and performance of all your containerized applications as they come online, regardless of the platform they're using behind the scenes
And whether your organization chooses a fully managed platform or hosts with Rancher, OpenShift, or Anthos, Datadog brings all of your Kubernetes infrastructure and application data together in a single, unified platform—from cluster status and low-level resource metrics to distributed traces and logs
Datadog automatically enriches your data with tags from Kubernetes, Docker, and cloud providers, making it easy to investigate events as they occur. Whether you're running dozens or thousands of nodes, Datadog provides deep visibility into your Kubernetes clusters with minimal setup, enabling you to safely build, deploy, and scale your container environments
All your Kubernetes data in one place
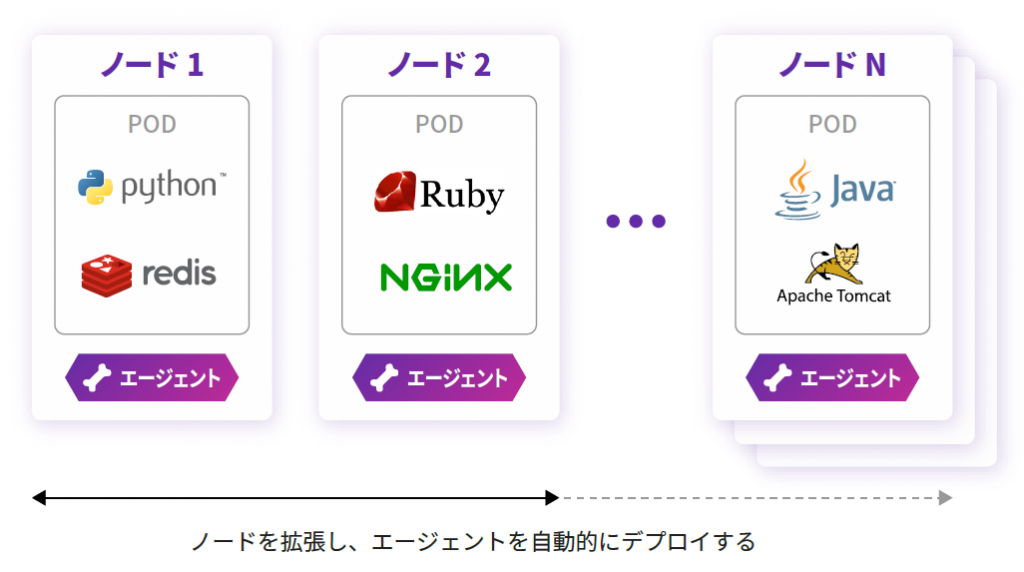
Datadog provides visibility into what's happening at every layer of your Kubernetes environment. Using a DaemonSet or the Datadog Operator, you can easily deploy the Datadog Agent to every node in your cluster. With Datadog's Kubernetes integration, you can:
◆ Maintaining a healthy control plane
● Tracking each part of the control plane
- Monitor the health and performance of all control plane components, including the scheduler, API server, controller manager, etc. A healthy control plane ensures that workloads can be scheduled and orchestrated properly, keeping your cluster running smoothly.
● Configure automated alerts
- Detect and resolve critical control plane issues, such as abnormal spikes in non-200 HTTP response codes, before they impact customers.
Troubleshooting Kubernetes issues
● Full-stack visibility into your Kubernetes environment
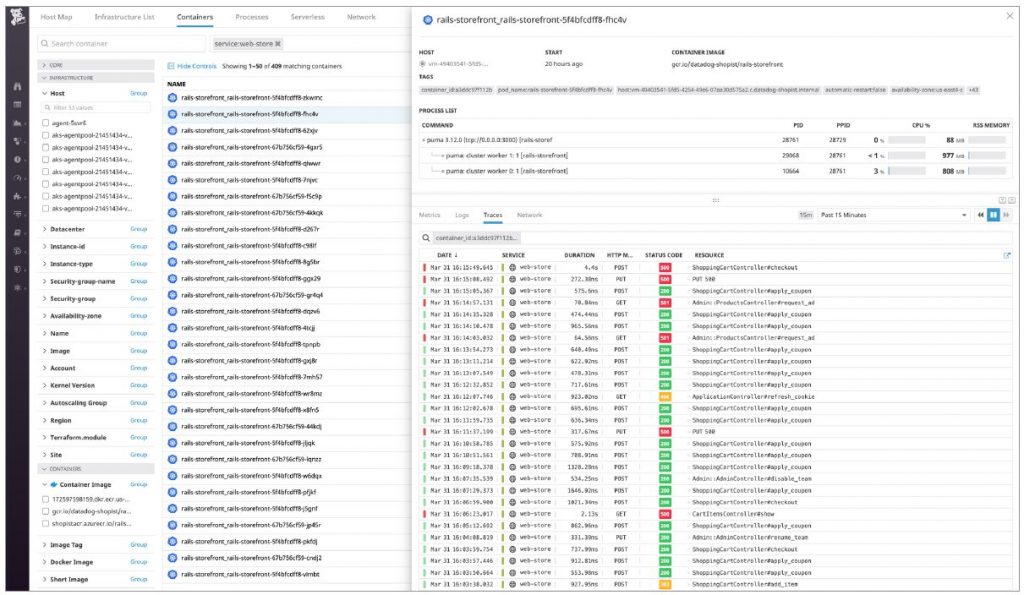
- Seamlessly navigate between metrics, logs, and distributed traces for your Kubernetes workloads and applications to quickly troubleshoot performance issues. Visualize your data in real time with customizable, easy-to-use dashboards.
● Analyze Kubernetes audit logs
and troubleshoot API authentication issues that may affect access to your cluster from users or services.
Drill down using tags
: Datadog automatically collects tags from your Kubernetes, Docker, and cloud providers, allowing you to easily sort, filter, and aggregate data. Quickly narrow the scope of an issue by region, container image, pod name, or other category, reducing your mean time to resolution.
◆ Automatically detects service status anywhere
Dynamically monitor orchestrated services
: Datadog detects changes in your cluster and automatically starts collecting data from various cluster components (such as the Kubernetes API server) and common infrastructure technologies (such as Apache Tomcat and Redis) without any user setup. You can also define custom configuration templates for Agent checks and specify which containers each check should monitor.
◆ Auto-scale workloads using any metric
● Ensure a high-quality customer experience, even at scale
: Using Datadog with Kubernetes' Horizontal Pod Autoscaler, you can maintain application availability even in the face of unexpected traffic. You can scale your workload based on any metric you monitor with Datadog, from integration-specific metrics (such as MySQL query throughput) to custom business metrics (e.g., daily page views).
summary
In a dynamic and variable infrastructure environment like Kubernetes, it can be difficult to operate using traditional monitoring tools, so we recommend introducing an integrated monitoring tool like Datadog to improve operational performance
Although this article was written from the perspective and concept of a Kubernetes container environment, some of the content also applies to the operation of the Auto Scaling function and environment for instances such as Amazon EC2 using cloud environments such as AWS, so we hope you will find this article useful

 3
3