Investigate the status of each server resource with sysstat
2017.04.26
 1
1 
table of contents
What is sysstat?
a monitoring tool for analyzing the load on Linux servers .
It can investigate CPU load, disk I/O usage, memory usage, and network device status.
The sysstat package contains the following commands:
sar, sadc, sadf, iostat, tapestat, cifsiostat, mpstat, and pidstat.
Now let's install it.
You can install it by running the following command.
# yum install sysstat
# rpm -qa | grep sysstat
sysstat-9.0.4-27.10.amzn1.x86_64
The packages are displayed, so they have been installed.
Now let's actually run each command.
sar
This command allows you to check the system's operating status
# sar [options] acquisition interval acquisition count
The first time I ran it without any options, the results were displayed in 10-minute intervals
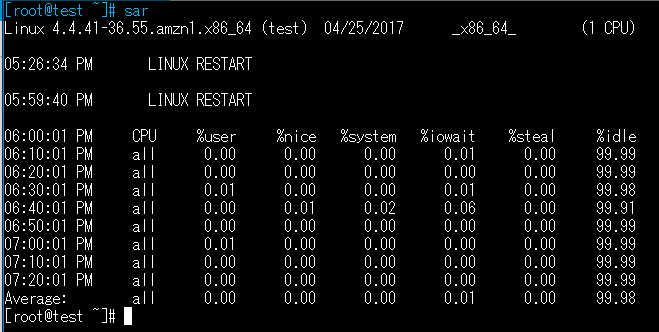
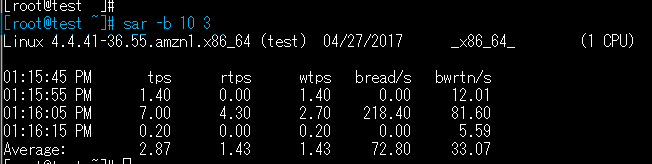
The second time, the command was executed to display the iowait status for 10 seconds x 3 times.
As with the first execution result, the average value at the time of command execution is displayed on the last line.
In addition, by specifying options, you can also check the CPU status and memory usage
# Check CPULA status sar -q # Check memory usage sar -r
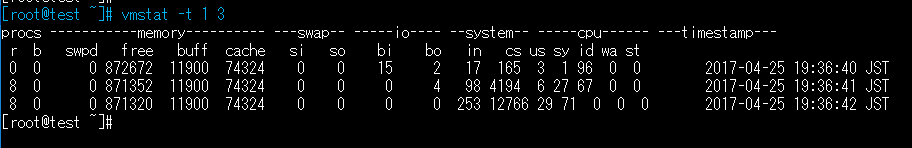
vmstat
This is a command that allows you to check memory, SWAP, disk I/O, and CPU usage
# vmstat [options] acquisition interval acquisition count
The "-t" option, which displays the acquisition time, is used to display the resource status three times per second
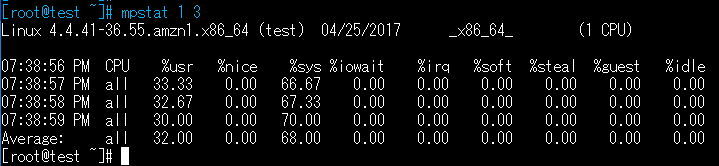
mpstat
This command allows you to check CPU usage
# mpstat [options] acquisition interval acquisition count
Compared to the sar and top commands, it displays the CPU processing time for each, such as %irq (hardware interrupt), %soft (CPU for software interrupt), and %guest (CPU running virtual servers)
Conclusion
, you can check the resource status
using the top command or ps command Check the server load with the load average.
How to find the cause of the server load.
If you want to know the normal load situation and long-term resource situation, a monitoring tool like Zabbix is suitable.
However, this time we introduced sysstat as one of the investigation methods when a failure occurs.
Once you install sysstat, you can run the commands introduced here, including the ones mentioned here.
Try using it in conjunction with commands that put a load on the server to check the resource status, or
try various combinations of options.
Thank you for reading this far.
11 The person who wrote this article
About the author