Get detailed process information on a Windows machine [tasklist command]

table of contents
Hello.
from the All You Can Eat Buffer Overflow
System Solutions Department.
It's the end of the year. This year was really hot.
I'd like to experience the four seasons a little more in my daily life next year.
Well, as the year comes to an end, many of you will be busy, but
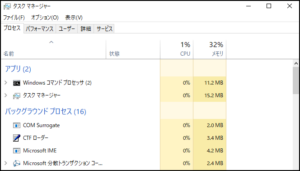
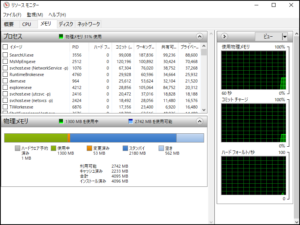
how do you check the process status of your Windows machine? If you just want a quick look, you might use Task Manager or Resource Monitor.
However, while they are easy to understand visually, sometimes you want to see more detailed information like in Linux.
⇩ Task Manager
⇩ Resource Monitor
tasklist is useful in such situations
It can be used flexibly,
with options to display additional information and (This article uses Windows Server 2019, but the behavior is the same on Windows 10 and 11.)
Example of using the tasklist command
To start, open the command prompt and type the "tasklist" command without thinking
tasklist
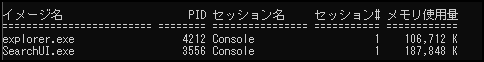
Then, a list of processes will be displayed as shown below.
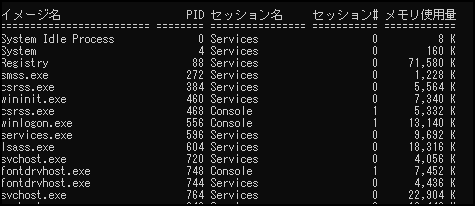
See the official documentation here
By default, only five items are displayed: "Image Name", "PID", "Session Name", "Session", and "Memory Usage", so
if you want to output more detailed information, add options. Help can be displayed as follows:
tasklist /?
View Details
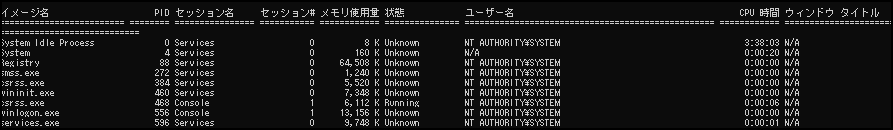
Just add /v to get various information
tasklist /v
Memory, status, and execution time are also clearly visible
Show processes using more than 100MB of memory
This is useful when you want to quickly identify processes that are using a lot of memory
tasklist /fi "memusage gt 100000"
Process output in CSV format
You can also output data separated by commas. You can also specify TABLE (default) or LIST
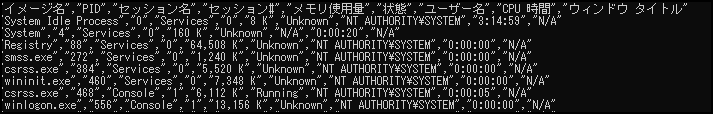
tasklist /v /fo csv
⇩⇩⇩It's hard to see like this, but
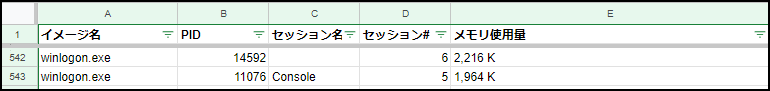
⇩⇩⇩If you paste it into a spreadsheet as is, you can check it like this and it's convenient because you can sort it just fine.
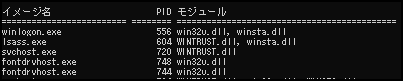
Search by module name
For example, pressing ⇩ will display processes for modules that start with "win*"
tasklist /m win*
By investigating using these tools,
you can identify processes with high memory usage and perform detailed investigations into what processes are running.
Please give it a try.
complete
 1717
1717 The person who wrote this article
About the author