Monitor specific strings in CloudWatch Logs!
2022.07.13
 11
11 
table of contents

* Nishimura Noodle Shop (Tsurumi Ward, Osaka City)
Hello!
I'm Hide, the Ramen King from Beyond Inc.'s Osaka office.
This is my sixth post.
Last time, I wrote about using a Chatbot to notify Cloudwatch alarms to Slack.
I wrote an interesting article about using a convenient tool called a Chatbot to notify, so if you're interested, please take a look!
What is a string monitor in CloudWatch Logs?
CloudWatch Logs is a feature of CloudWatch, which monitors AWS resources, and allows you to easily collect application and access logs from Amazon EC2 and store them in the cloud
Since logs can be saved on the cloud, they can be easily searched for when you want to check a specific log.
Another attractive feature is that collected logs can be centrally managed in one service, which reduces the effort required for management.
Next, string monitoring is a monitoring method that monitors application and access logs, etc. collected to improve business efficiency in real time, and if it detects a certain format or specific string of characters output as a condition, it notifies a communication tool. In the unlikely event that a problem does occur, it can be detected early, allowing the problem to be resolved quickly
Implementing log monitoring with CloudWatch Logs is very easy, so let's take a look at the steps together!
Configuration diagram
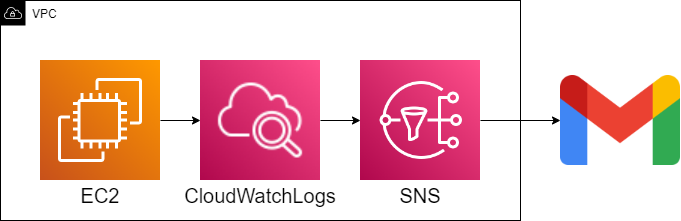
Install an agent for CloudWatch Logs in EC2 and the agent will send logs present in EC2 to the console
Next, an alert will be sent based on the conditions that include a specific string set in the console. Looking at the configuration, it doesn't seem that difficult, so let's try our best to set it up
Construction procedure
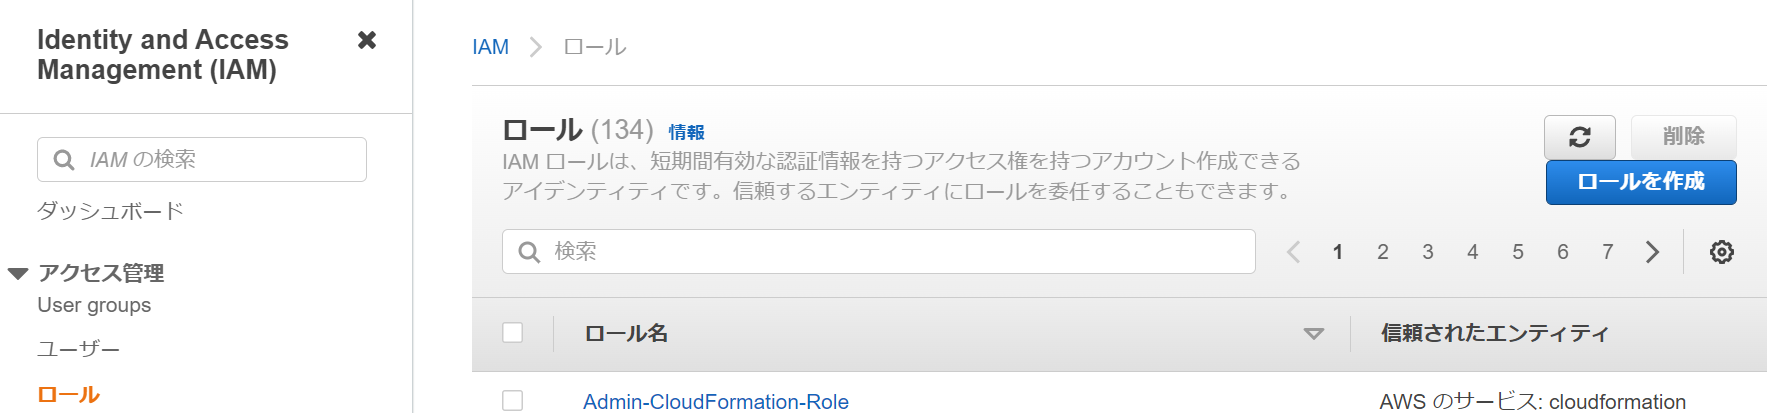
① Create an IAM role
①-①: Go to IAM > Roles and click [Create Role]
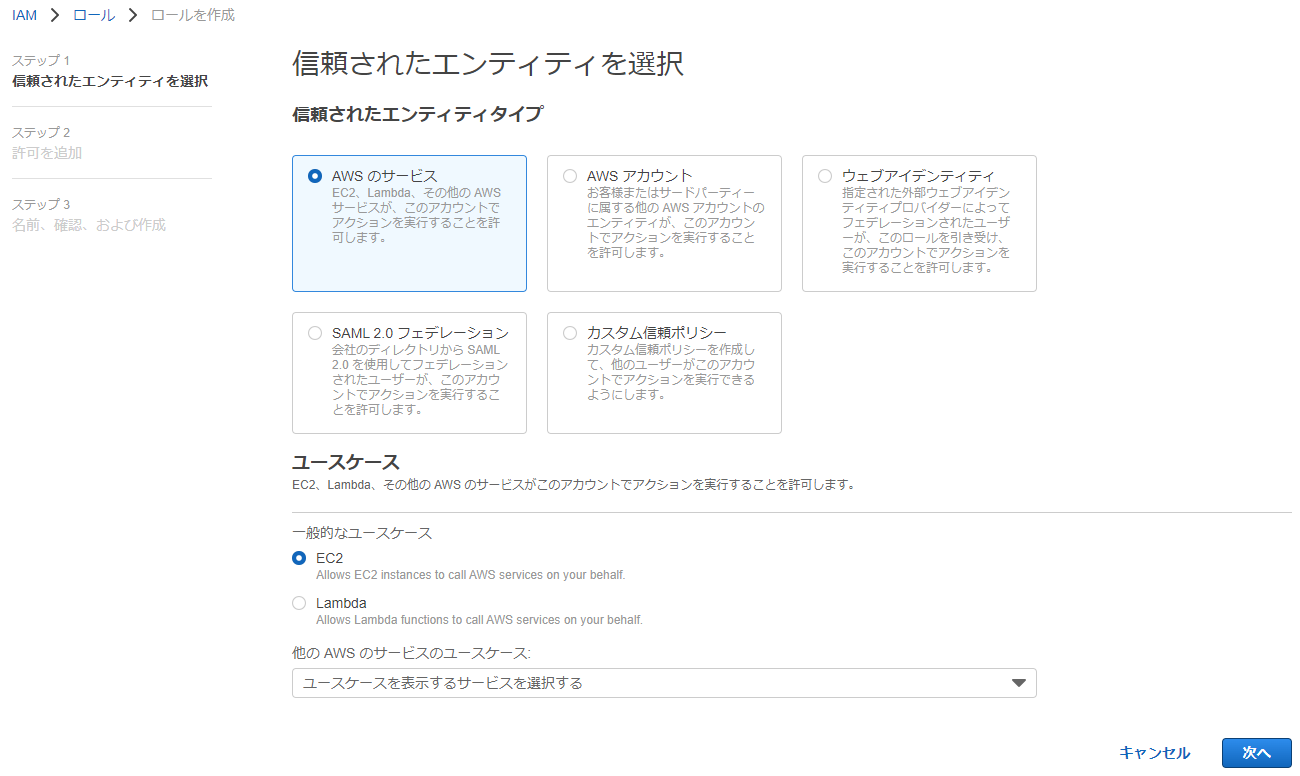
①-②: Select the following and click [Next]
● Trusted entity type: AWS service
● Use case: EC2
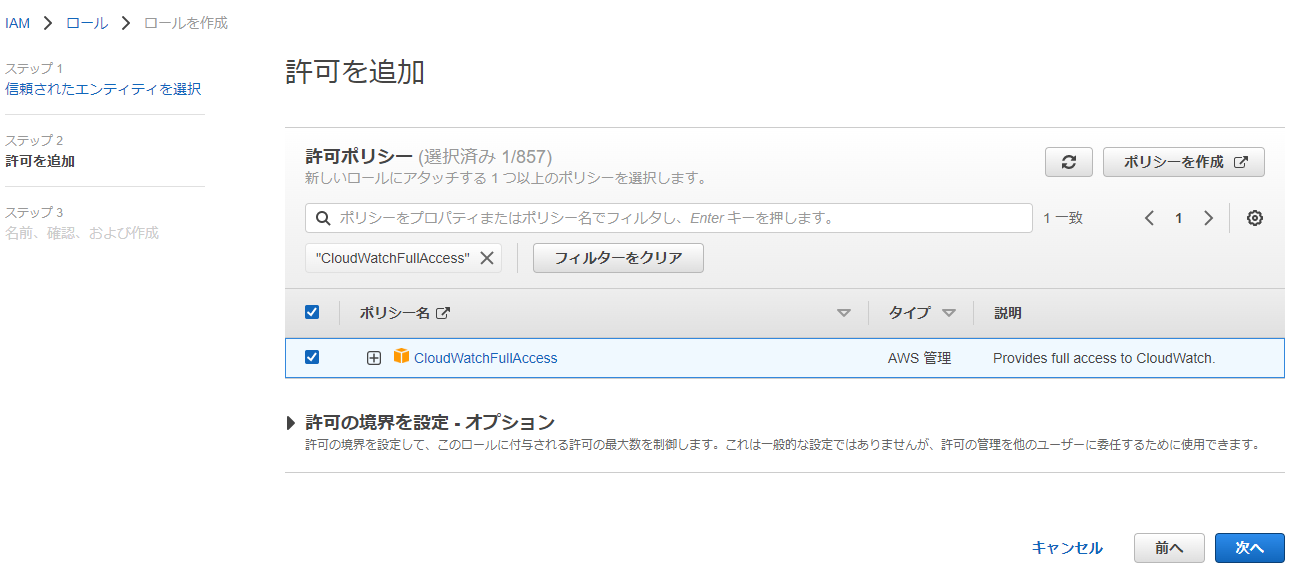
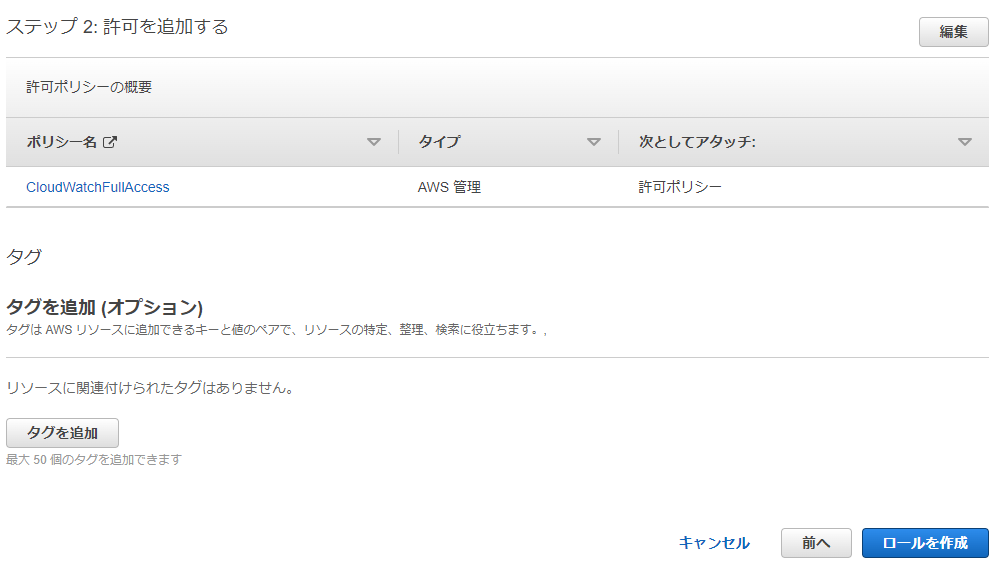
①-③: Select [CloudWatchFullAccess] and click [Next]
①-④: Enter the role name and description and click [Create role]

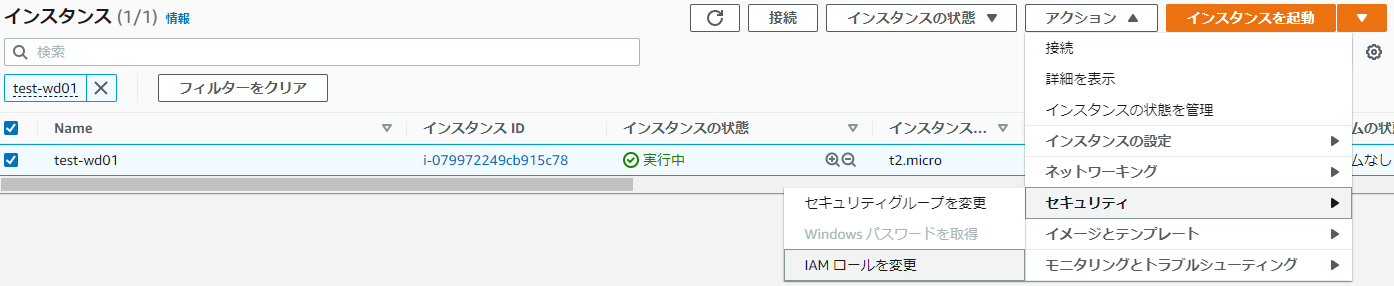
①-⑤: EC2 > Select the instance you created > Actions > Security > Change IAM role
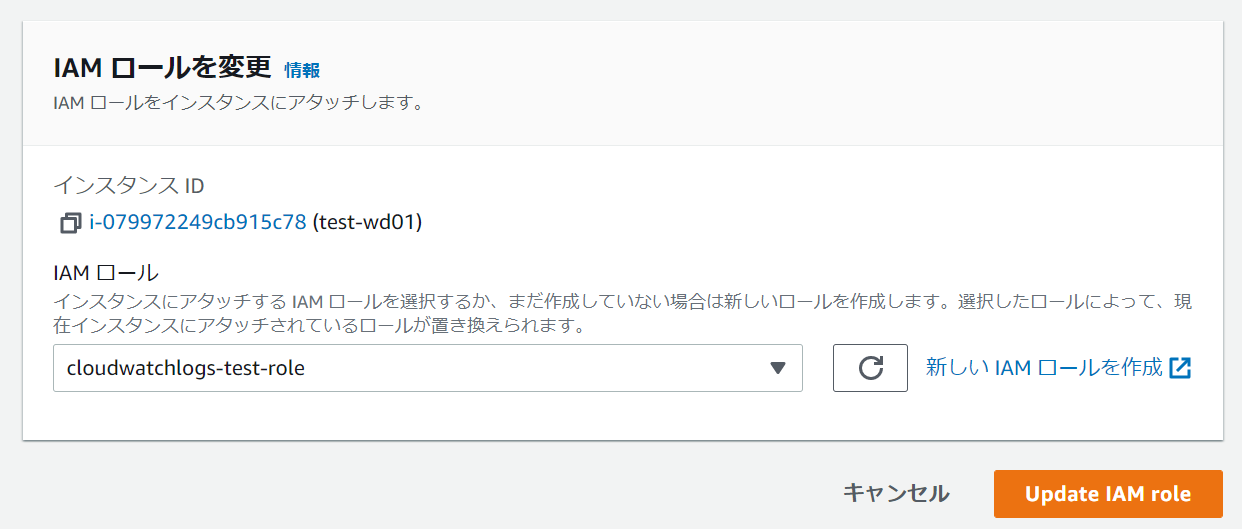
①-⑥: Select the IAM role you just created and click [Update IAM role]
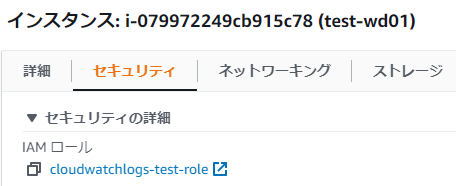
*If the security tab of the created instance shows the following, the application is complete

② CloudWatch Logs Agent Settings
②-①: Log in to the server
②-②: Install the CloudWatch Logs agent
*If you are using Amazon Linux, you can install it using the following command:
yum install amazon-cloudwatch-agent
*The installation method is different for operating systems other than Amazon Linux.
For CentOS, the installation method is described based on the official website
1. Download the CloudWatch agent
*Download links differ depending on the OS, so please refer to here
wget https://s3.amazonaws.com/amazoncloudwatch-agent/centos/amd64/latest/amazon-cloudwatch-agent.rpm
2. Install the CloudWatch agent
rpm -U ./amazon-cloudwatch-agent.rpm
*In addition, the following agents deprecated , so please install them as described above.
yum install awslogs
②-③: Start the setup wizard
/opt/aws/amazon-cloudwatch-agent/bin/amazon-cloudwatch-agent-config-wizard
②-④: Agent settings
== ... EC2 or On-Premises hosts? 1. EC2 2. On-Premises default choice: [1]: *Select 1 for EC2 1 Which user are you planning to run the agent? 1. root 2. cwagent 3. others default choice: [1]: *Select 1 if root is OK 1 Do you want to turn on StatsD daemon? 1. yes 2. no default choice: [1]: *Select 1 as this is required to collect custom metrics 1 Which port do you want StatsD daemon to listen to? default choice: [8125] *Click Enter if OK What is the collect interval for StatsD daemon? 1. 10s 2. 30s 3. 60s default choice: [1]: *Select 1 if you are happy with this 1 What is the aggregation interval for metrics collected by StatsD daemon? 1. Do not aggregate 2. 10s 3. 30s 4. 60s default choice: [4]: *Select 4 if you are happy with this 4 Do you want to monitor metrics from CollectD? WARNING: CollectD must be installed or the Agent will fail to start? 1. yes 2. no default choice: [1]: *Select 2 as I am only using cloudwatchlogs 2 Do you want to monitor any host metrics? e.g. CPU, memory, etc. 1. yes 2. no default choice: [1]: *Select 2 as I am only using cloudwatchlogs 2 Do you have any existing CloudWatch Log Agent (http://docs.aws.amazon.com/AmazonCloudWatch/latest/logs/AgentReference.html) configuration file to import for migration? 1. yes 2. no default choice: [2]: *Please select 2 as there is no cloudwatchlogs configuration file 2 Do you want to monitor any log files? 1. yes 2. no default choice: [1]: *Please select 1 as a cloudwatchlogs configuration file is required 1 Log file path: *Please enter the desired log path /var/log/messages Log group name: *Please enter the desired log group name default choice: [messages] cloudwatchlogs-test Log stream name: *Please enter the desired log stream name default choice: [{instance_id}] /var/log/messages Log Group Retention in days (Log group retention period) 1. -1 2. 1 3. 3 4. 5 5. 7 6. 14 7. 30 8. 60 9. 90 10. 120 11. 150 12. 180 13. 365 14. 400 15. 545 16. 731 17. 1827 18. 2192 19. 2557 20. 2922 21. 3288 22. 3653 default choice: [1]: *Please enter the desired log retention period (-1 means unlimited) 1 Do you want to specify any additional log files to monitor? 1. yes 2. no default choice: [1]: *If you do not want to add a configuration file, select 2. 2 Saved config file to /opt/aws/amazon-cloudwatch-agent/bin/config.json successfully. Current config as follows: { "agent": { "run_as_user": "root" }, "logs": { "logs_collected": { "files": { "collect_list": [ { "file_path": "/var/log/messages", "log_group_name": "cloudwatchlogs-test", "log_stream_name": "/var/log/messages", "retention_in_days": -1 } ] } } }, "metrics": { "metrics_collected": { "statsd": { "metrics_aggregation_interval": 60, "metrics_collection_interval": 10, "service_address": ":8125" } } } } Please check the above content of the config. The config file is Also located at /opt/aws/amazon-cloudwatch-agent/bin/config.json. Edit it manually if needed. Do you want to store the config in the SSM parameter store? 1. yes 2. no default choice: [1]: *Select 2 if you do not need to register with SSM 2 Program exits now.
*Supplementary materials
● Reference: What is
StatsD ● Reference: CollectD ?
②-⑤: Start the agent
/opt/aws/amazon-cloudwatch-agent/bin/amazon-cloudwatch-agent-ctl -a fetch-config -m ec2 -s -c file:/opt/aws/amazon-cloudwatch-agent/bin/config.json
②-⑥: Check the agent's status
systemctl status amazon-cloudwatch-agent
● amazon-cloudwatch-agent.service - Amazon CloudWatch Agent Loaded: loaded (/etc/systemd/system/amazon-cloudwatch-agent.service; enabled; vendor preset: disabled) Active: active (running) since Fri 2022-08-05 06:33:34 UTC; 3min 46s ago Main PID: 1352 (amazon-cloudwat) CGroup: /system.slice/amazon-cloudwatch-agent.service mq1352 /opt/aws/amazon-cloudwatch-agent/bin/amazon-cloudwatch-agent -config /opt/aws/amazon-cloudwatch-agent/etc/amazon-cloudwatch-agent.toml -envconfig /opt/aws/amazon-cloudwatch-agent/etc/env-config.json -pidfile /opt/aws... Aug 05 06:33:34 ip-172-31-39-31.ap-northeast-1.compute.internal systemd[1]: Started Amazon CloudWatch Agent. Aug 05 06:33:34 ip-172-31-39-31.ap-northeast-1.compute.internal start-amazon-cloudwatch-agent[1352]: /opt/aws/amazon-cloudwatch-agent/etc/amazon-cloudwatch-agent.json does not exist or cannot read. Skipping it. Aug 05 06:33:34 ip-172-31-39-31.ap-northeast-1.compute.internal start-amazon-cloudwatch-agent[1352]: I! Detecting run_as_user...
③ Check if the data is collected on the console
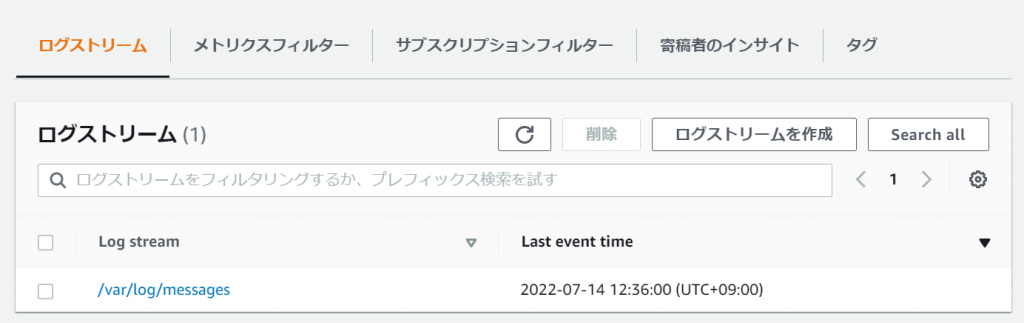
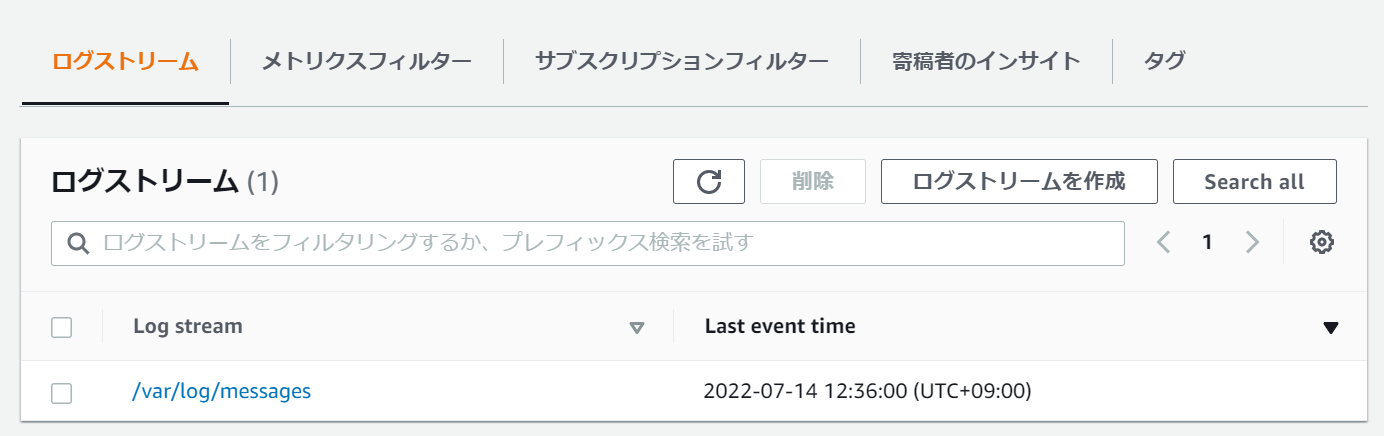
③-①: Check the log group you specified in cloudwatch > Log groups and click it
③-②: Confirm that the log is saved under the specified log stream name and click
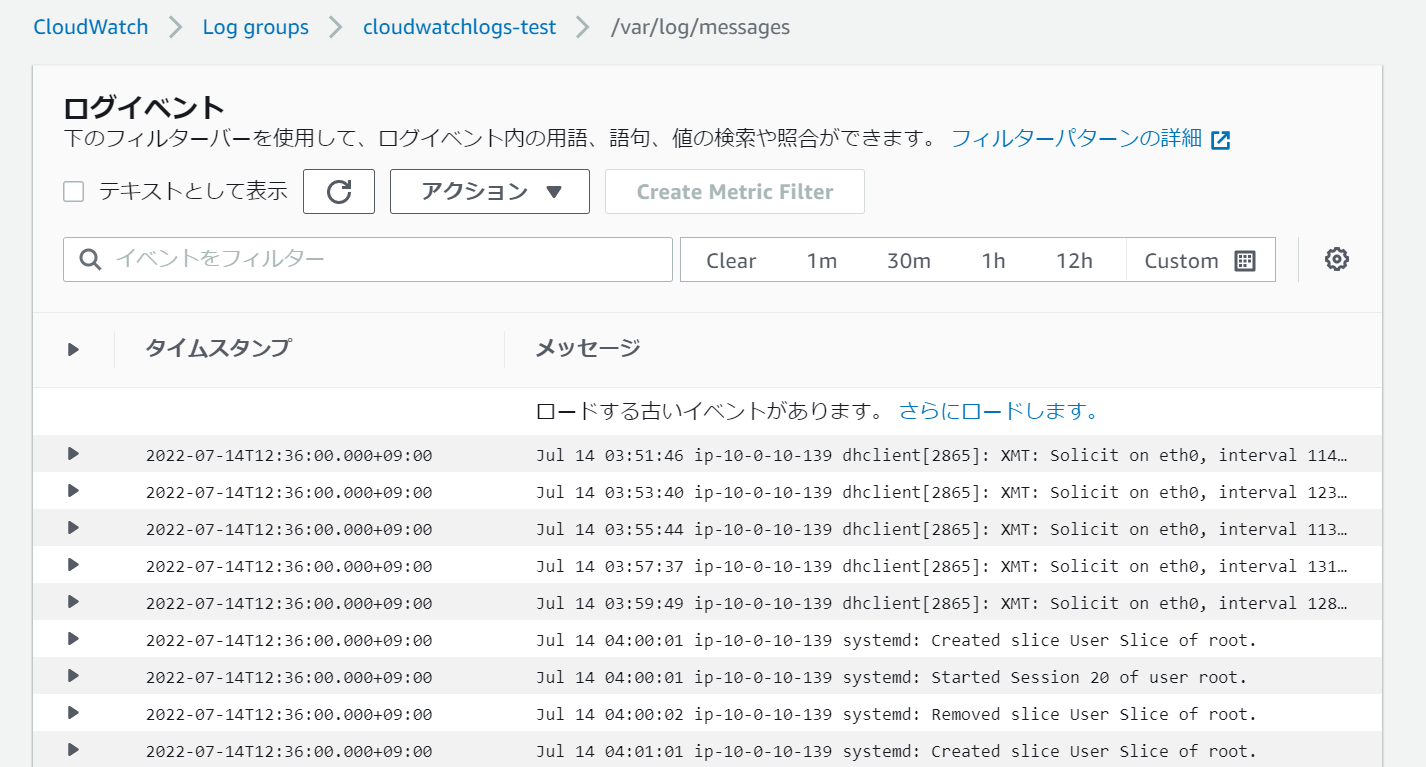
③-③: Check the log to see if it was collected correctly
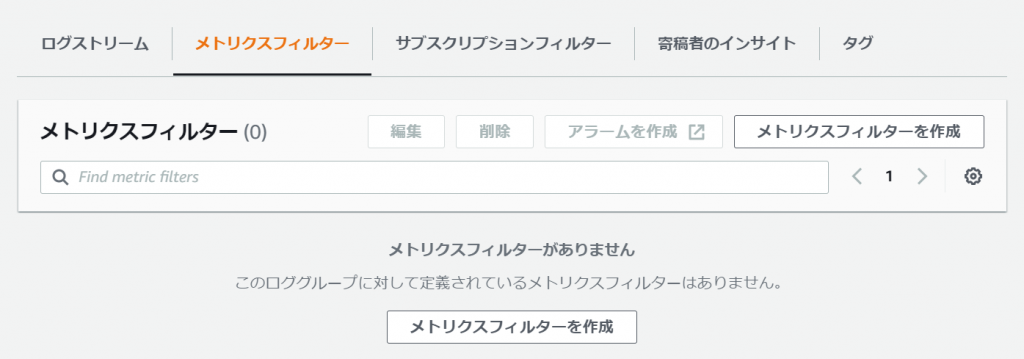
④ Create a metric filter
④-① Click [Create Metric Filter]

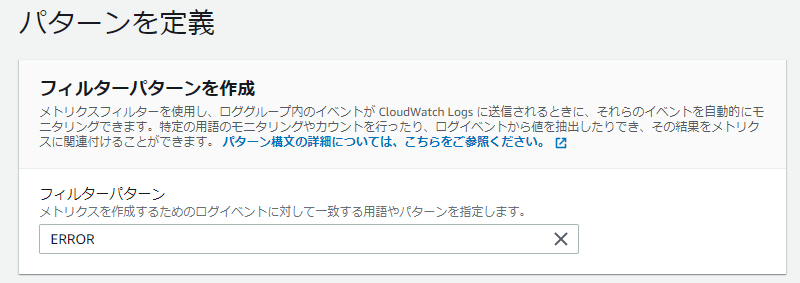
④-②: Define the filter pattern
*There are various ways to define patterns, so please refer to here
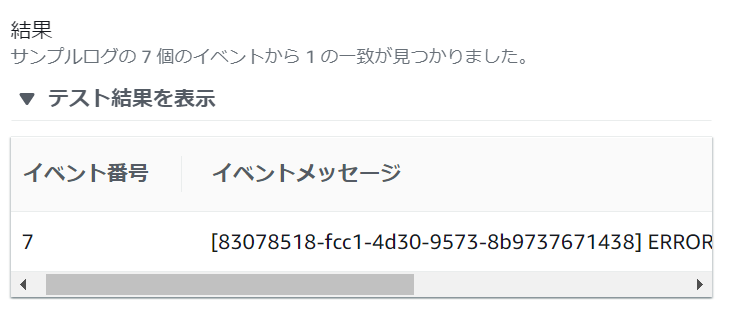
④-③: Test the filter pattern and if there are no problems, click [Next]
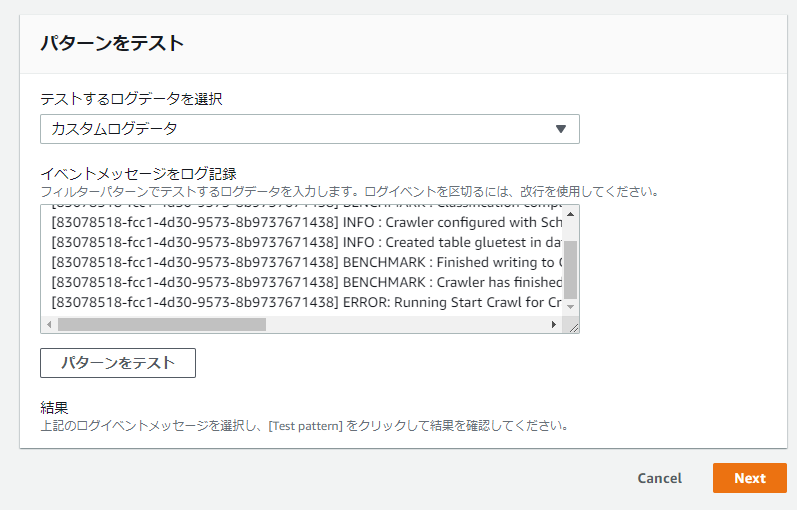
*Test method
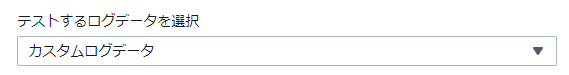
1. Select the log data to test and select [Custom Log] or [Log Stream Name].
2. Create a log that matches the filter pattern in [Log event message] and click [Test pattern]
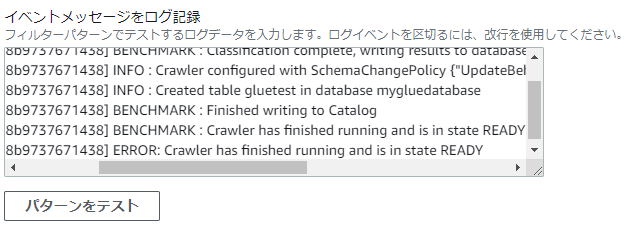
3. Once the test results are reflected, the process is complete
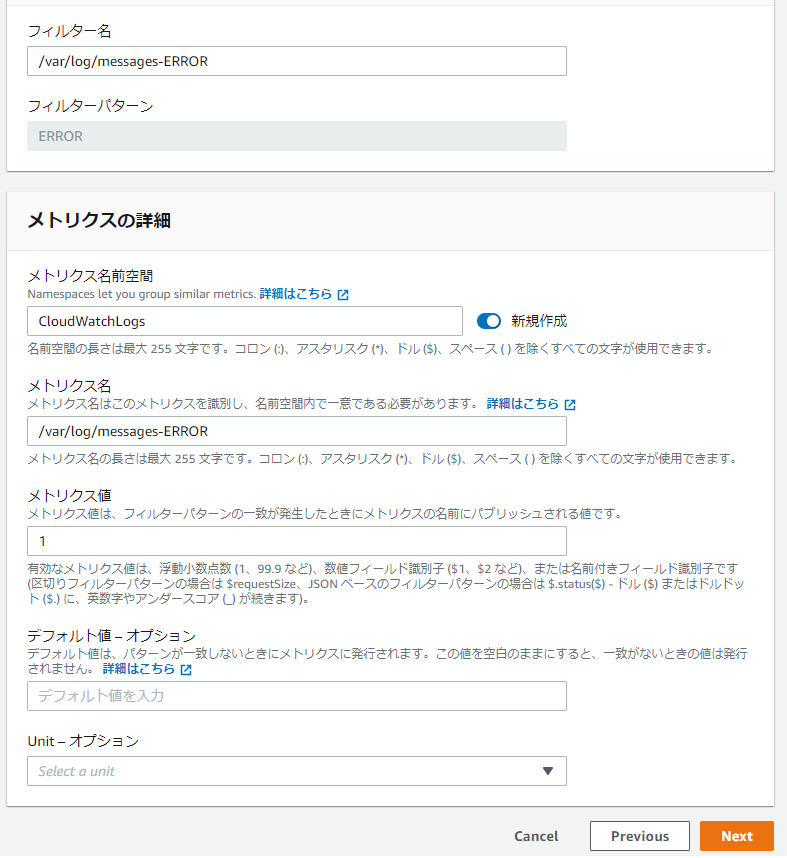
④-④: Fill in the following information
● Filter Name: The name of the filter itself
● Metric Namespace: The name of the namespace to which CloudWatch will send metrics
● Metric Name: The name of the metric created under the specified namespace
● Metric Value: The numerical value when published as a metric
● Default Value: The value published for the metric when the pattern does not match. If left blank, no value will be published.
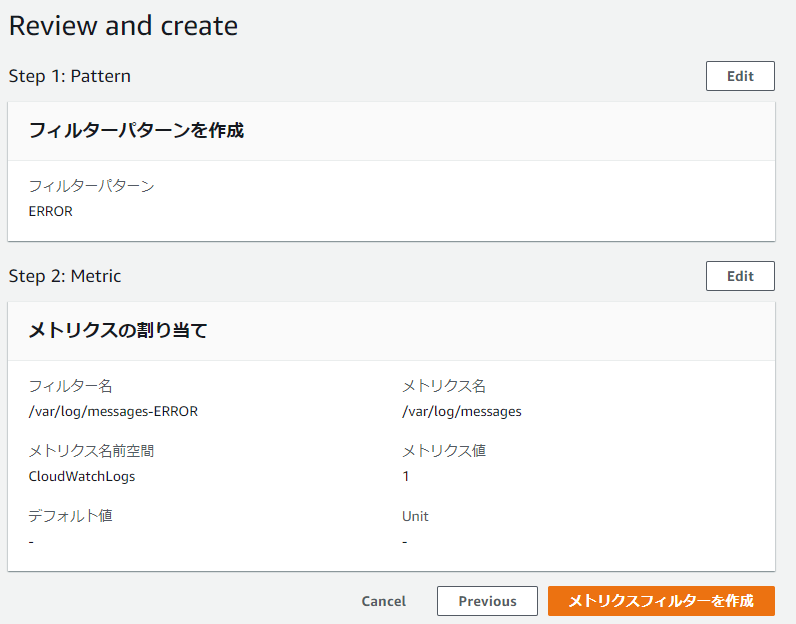
④-⑤: If there are no problems, click [Create Metric Filter]
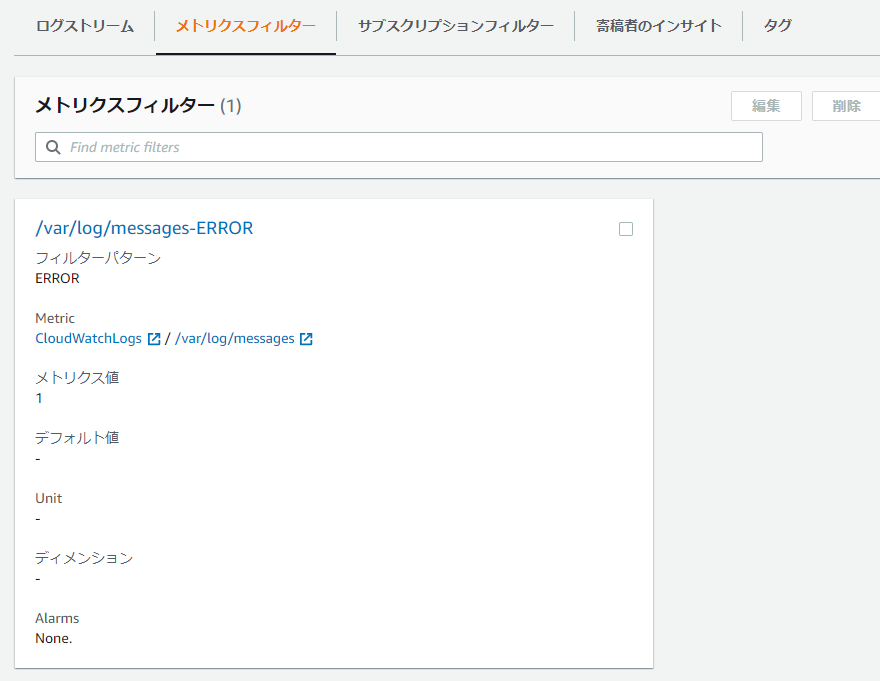
④-⑥: Complete once created as shown below
⑤ Set up SNS
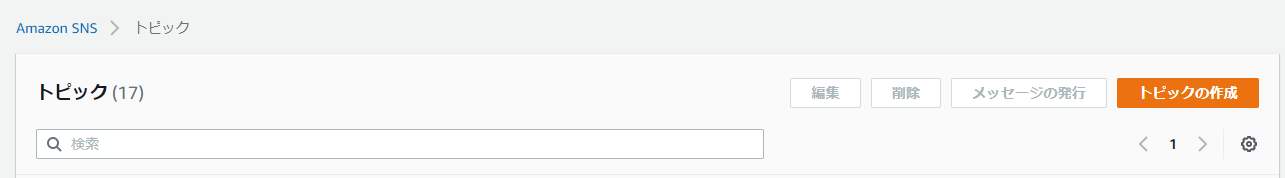
⑤-①: Click [Create Topic] in SNS > Topics
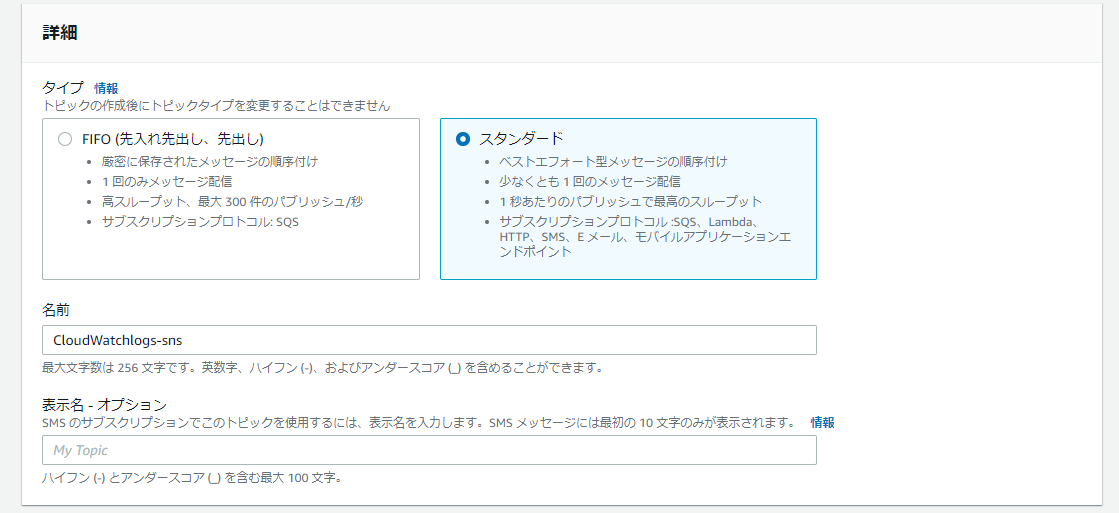
⑤-②: Set the following information and click [Create Topic]
● Type: Standard
● Name/Description: Please specify freely
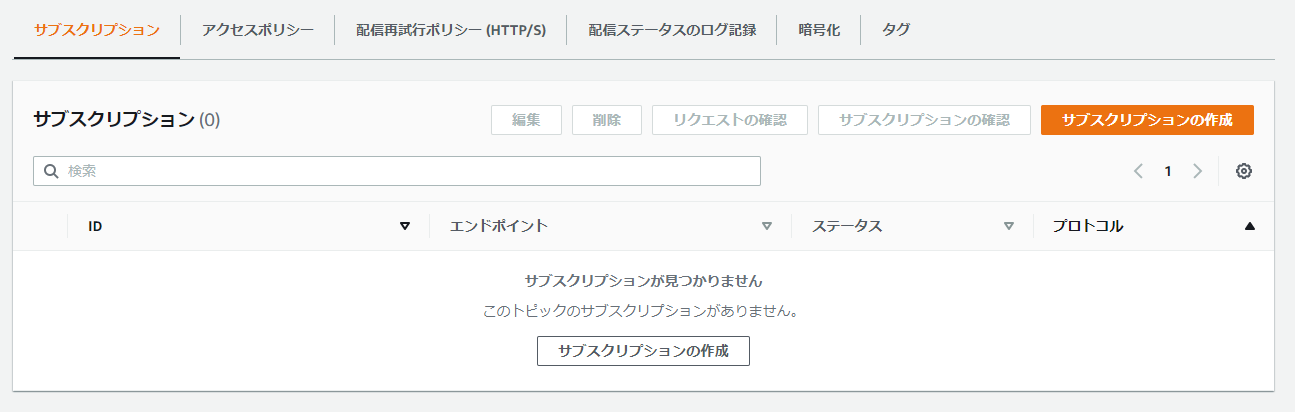
⑤-③: Click [Create Subscription]
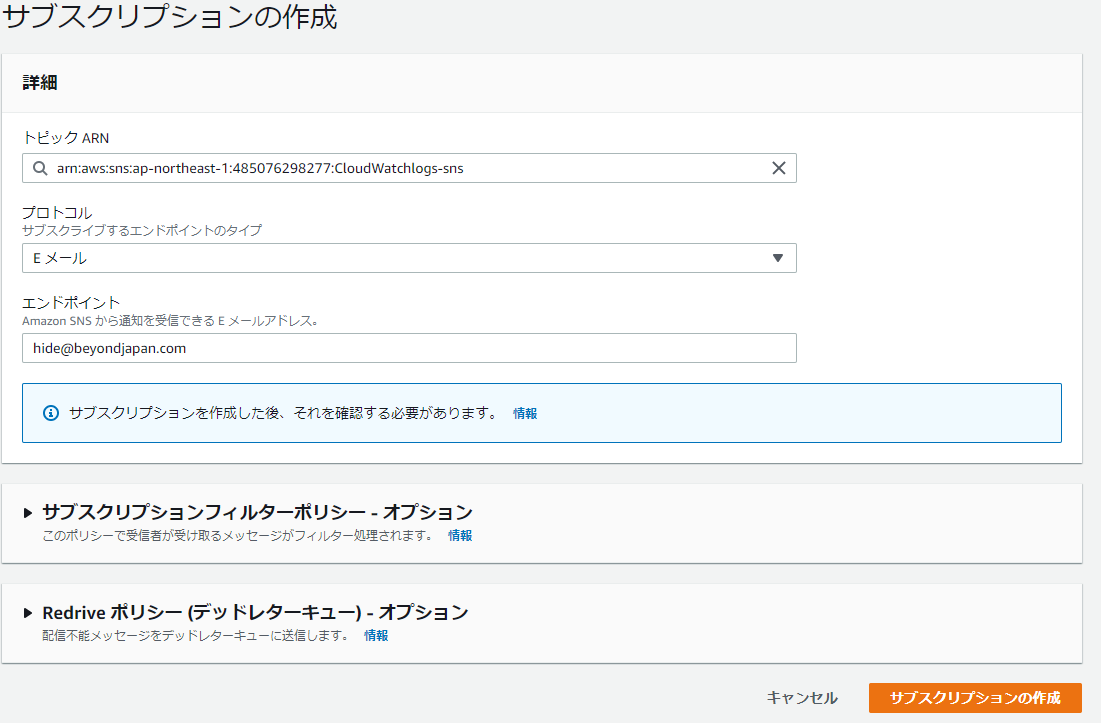
⑤-④: Fill in the information below and click [Create Subscription]
● Protocol: Email
● Endpoint: Your email address
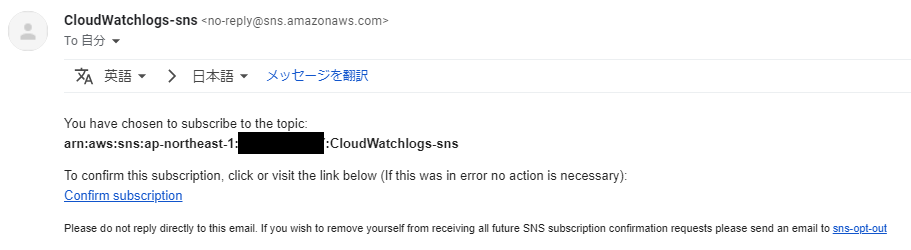
⑤-⑤: You will receive a confirmation email, so click [Confirm subscription]
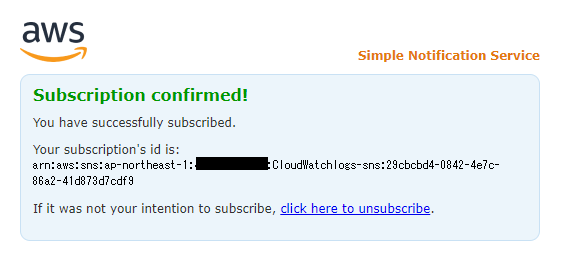
⑤-⑥: When the following message appears, it's complete
⑥ Create a CloudWatch alarm
⑥-①: As a test, output a log containing a specific string to a specified log file on the server
*Since messages is specified, the logger command is used, but anything that can output a log is fine.
*If the metric filter cannot detect it even once, you will not be able to select the metric when creating an alarm, so this is a test.
logger "ERROR"
⑥-②: CloudWatch > Alarms > Click [Create Alarm]

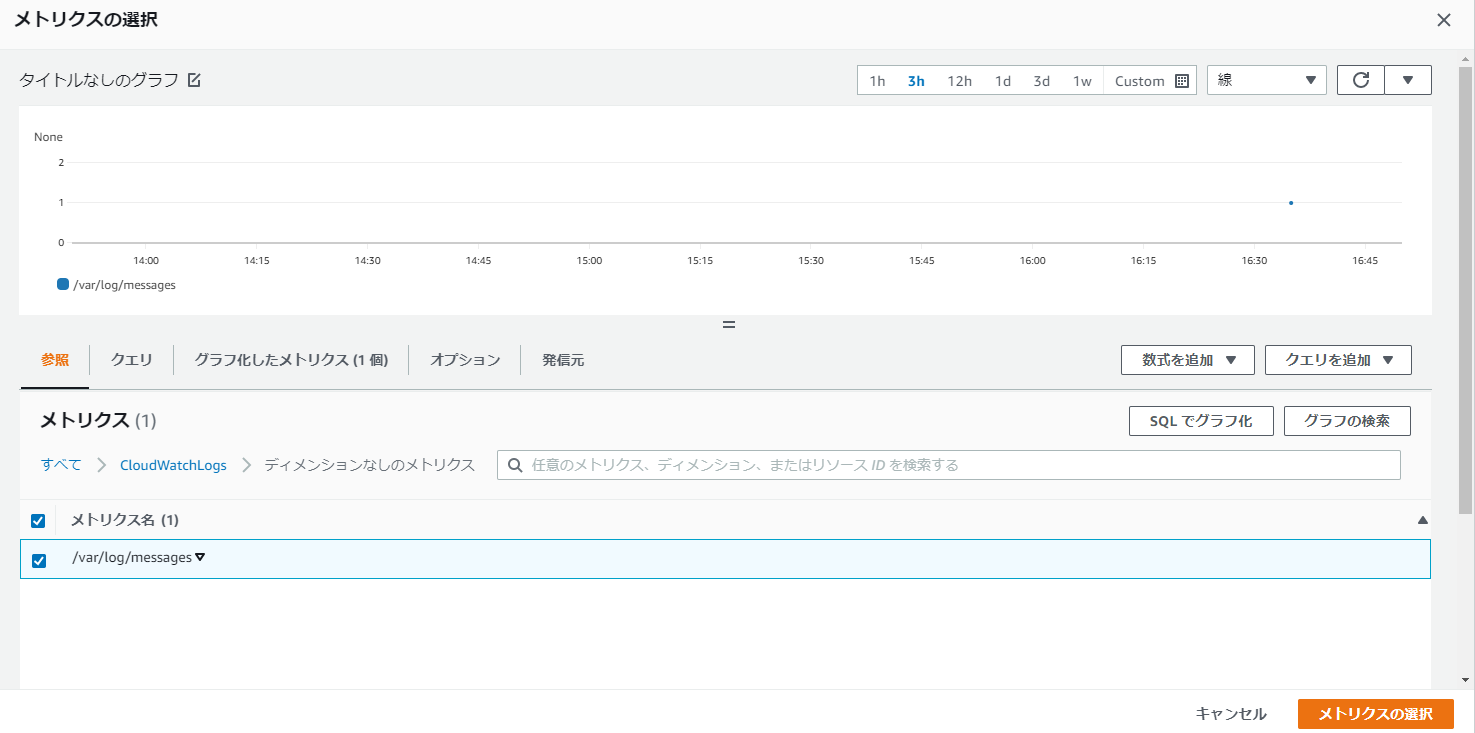
⑥-③: Select the namespace you created > Metrics without dimensions > the name of the metric you created and click [Select Metric]
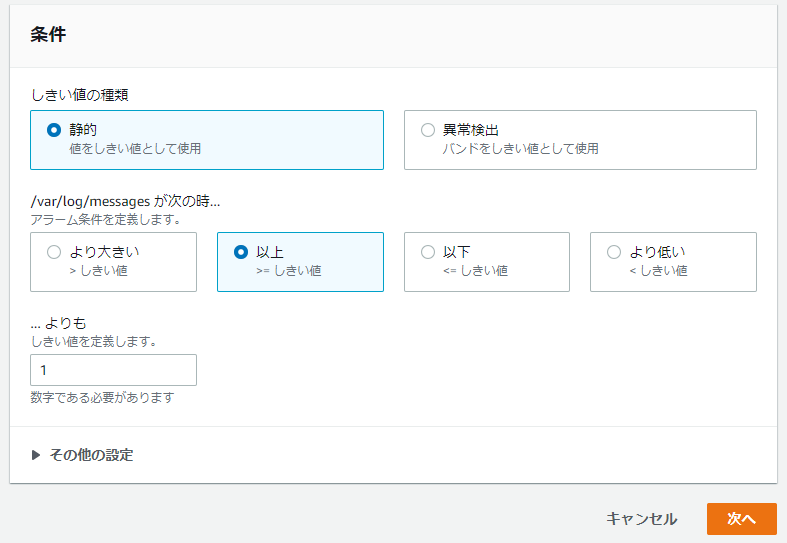
⑥-④: Set the conditions and click [Next]
*In the following example, an alarm will be sent if a specific string is detected at least once
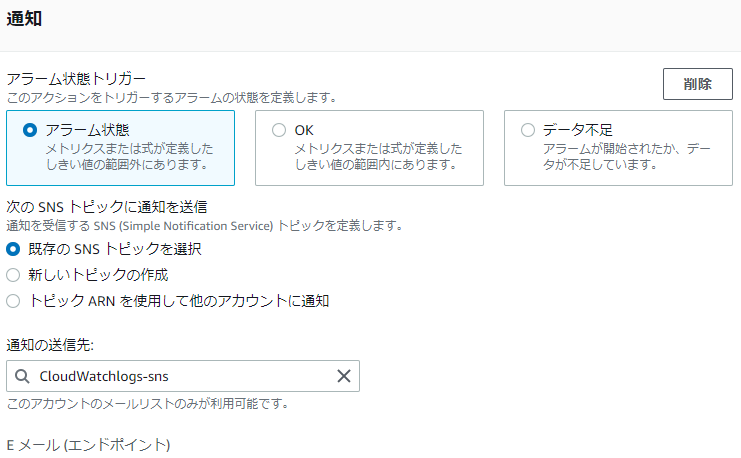
⑥-⑤: Select the topic you created and click [Next]
*Since this is a string monitoring, recovery notification settings are not required
⑥-⑥: Enter the name of the alarm you created and click [Next]
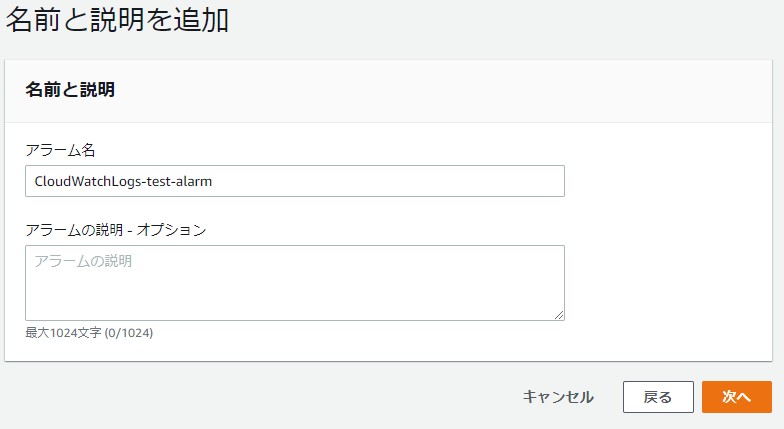
⑥-⑦: If there are no problems with the settings, click [Create alarm]

⑦ Operation check
⑦-①: As a test, output a log containing a specific string to a specified log file on the server
*Since messages is specified, we are using the logger command, but anything that can output a log will do
logger "ERROR"
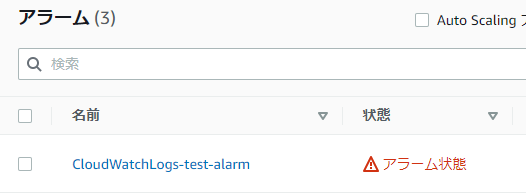
⑦-②: Check that the alarm is in [Alarm state]
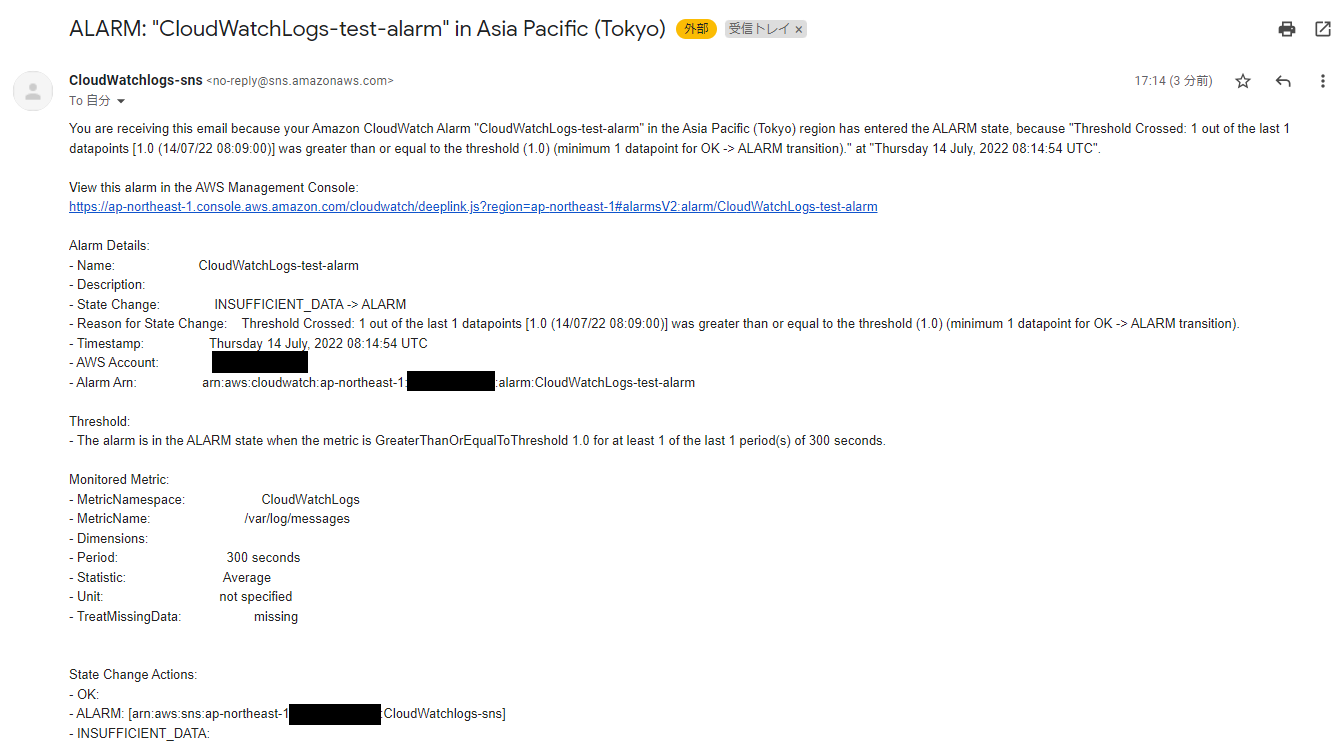
⑦-③: Check if you have received an email regarding the alarm
*If the alarm email has been sent to your email address, the process is complete
summary
I hope you found it easy to set specific strings in metric filters for logs collected by CloudWatch Logs and have them notify you as alarms
When monitoring strings in AWS, you can easily do so by using CloudWatch, so be sure to try using it for operational monitoring!
In addition to email, you can also send notifications to Slack, Teems, and Chatwork. I wrote about how to set this up in my previous blog, so if you're interested, check it out!
thank you very much!
◇ I tried notifying CloudWatch alarms to Teams and Chatwork!
◇ Use AWS Chatbot to notify CloudWatch alarms to Slack!
1111 The person who wrote this article
About the author